Figure 3.

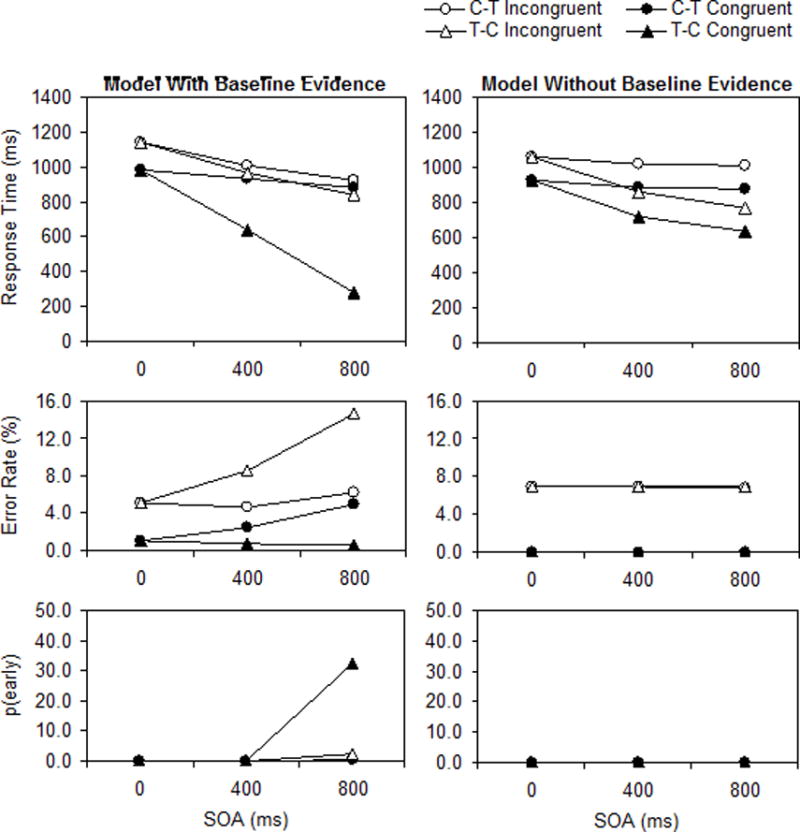
Predictions (means) of the model with and without baseline evidence (left and right panels, respectively). C−T = cue−target order, T−C = target−cue order, SOA = stimulus onset asynchrony, p(early) = percentage of early responses.

Predictions (means) of the model with and without baseline evidence (left and right panels, respectively). C−T = cue−target order, T−C = target−cue order, SOA = stimulus onset asynchrony, p(early) = percentage of early responses.