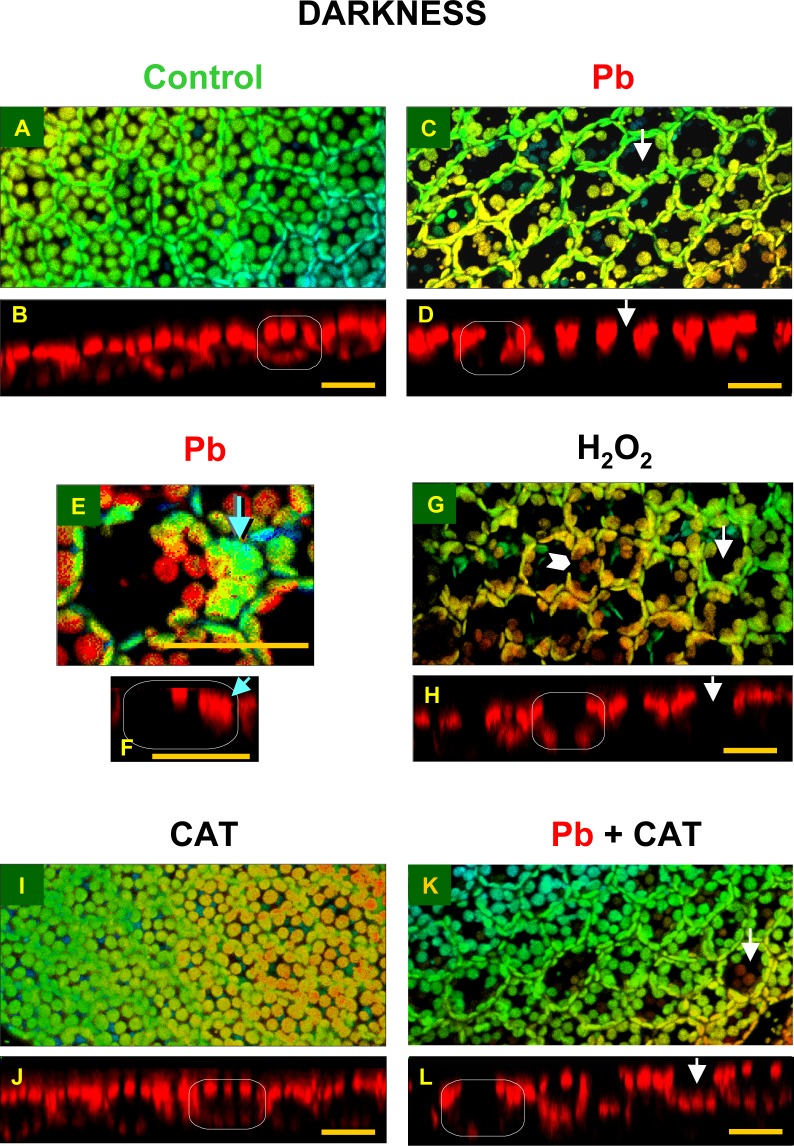
Fig 2. Distribution of chloroplasts in mesophyll cells of Lemna trisulca fronds in darkness.
In control plants (A, B) and in plants treated with lead (15 μM Pb2+; C-F), hydrogen peroxide (10–3 M H2O2; G, H), catalase (100 U; I, J) or simultaneously with lead and catalase (15 μM; K, L) for 24 h (in the case of H2O2, plants were treated with it for the last 3 h only). The larger micrographs show 3D reconstructions of frond fragments, obtained on the basis of a series of optical sections adjacent to the surface of fronds in a confocal microscope (S1 Fig.). The reconstructions include chloroplasts from a single layer of mesophyll cells (in some places tiny epidermal chloroplasts are also visible). A color scale is used to highlight the image depth (warm colors represent chloroplasts located closer to the viewer, while the cool ones, the more distant organelles). The smaller micrographs show chloroplast distribution (red autofluorescence) in cell cross-sections in single optical sections (S1 Fig.). The white rectangle presents a schematic outline of a cross-section of a single cell. The white arrows indicate chloroplast-free areas visible in 3D reconstruction and the corresponding locations in cross-sections. Blue arrows (E, F) indicate places in which chloroplast clusters are present, while the white arrowhead (G) points to the area neighboring the anticlinal wall, where chloroplasts were absent. Scale bar = 20 μm.

