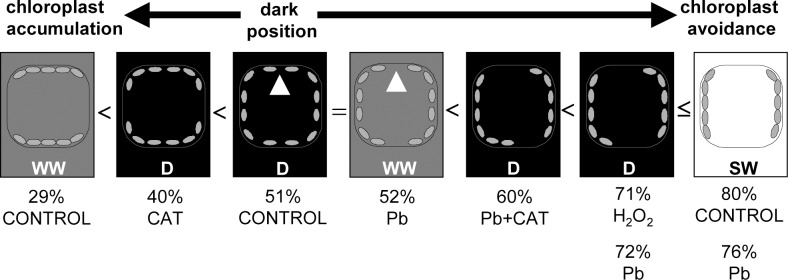
Fig 4. Summary of results shown in Figs. 2–5.

A diagram of chloroplast distribution in cross-sections of Lemna trisulca cells of control plants and plants treated with lead, hydrogen peroxide (H2O2), catalase (CAT), or simultaneously with lead and catalase in darkness (D) and weak or strong white light (WW or SW, respectively). The numbers show the percentage of chloroplasts in the profile position in the particular variants (in ascending order). Two numbers under a cell indicate an absence of significant differences between two experimental variants. The symbol ≤ denotes that differences between Pb-SW and both Pb-D and H2O2-D are not significant but they are significant between control-SW and both Pb-D and H2O2-D. Also control-D and Pb-WW did not differ in the number of chloroplasts in the profile position, but the variants were illustrated separately in view of a difference in chloroplast distribution (marked with white arrowheads). The diagram shows three basic chloroplast positions in control variants: chloroplast accumulation (in WW light), dark position (in D), and chloroplast avoidance (in SW).
