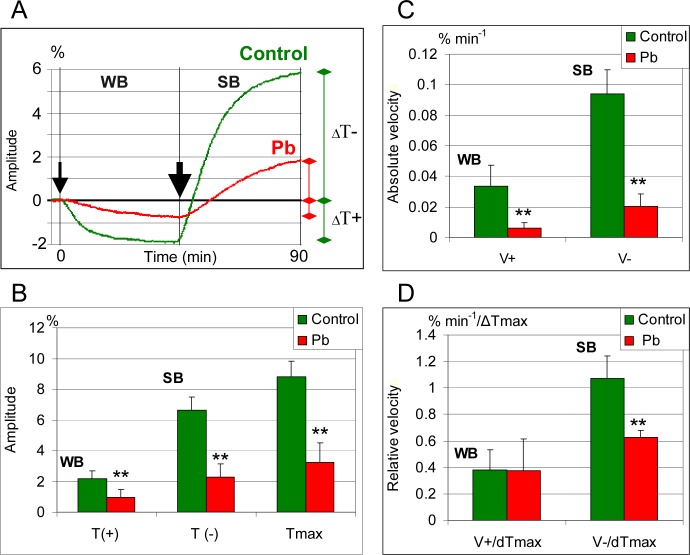
Fig 6. Chloroplast displacements in mesophyll cells of Lemna trisulca in blue light.
Weak blue (WB, 2 μE m-2s-1) and strong blue light (SB, 113 μE m-2s-1) in the presence of lead (15 μM Pb2+) and in control plants. The line graph (A) illustrates changes in the location of chloroplasts (recorded on the basis of red light transmittance) during 45 min of exposure to constant weak blue light (a thin arrow marks when the light was turned on; darkness was the starting position) and during 45 min of exposure to strong blue light (a thick arrow marks when the strong light was turned on). The column diagrams (B-D) show amplitude of accumulation [ΔT(+), marked as T(+)] and avoidance [ΔT(-), marked as T(-)] as well as the maximum amplitude [ΔTmax = ΔT(-) + ΔT(+), marked as Tmax]; absolute velocity (% min-1) of accumulation [V(+)] and avoidance [V(-)]; and relative velocity (% min-1/ΔTmax) of accumulation [V(+)] and avoidance [V(-)]. **p < 0.05.

