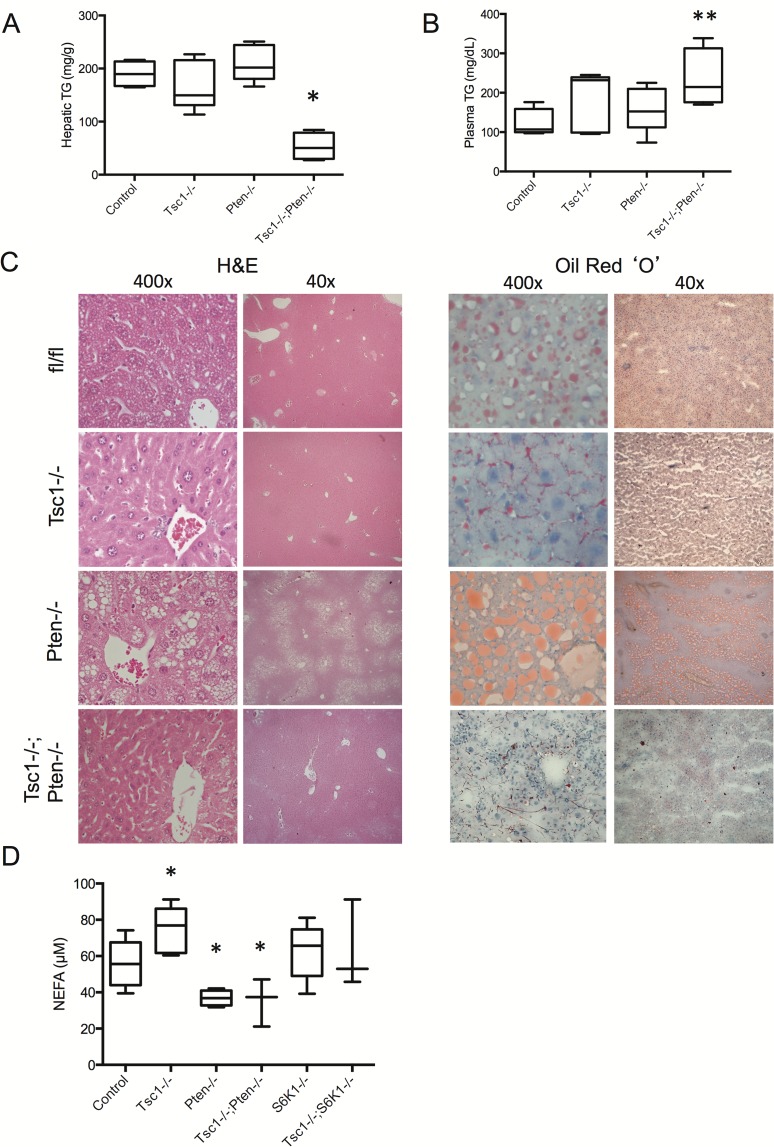
Figure 5. Pten deletion does not promote steatosis in the Tsc1-/- livers.
A) Liver TG content and B) Plasma TG. *, p<0.01 compared to all other groups. **, p<0.05 compared to control. N = 4–6 mice per group. C) Liver histology by H&E and Oil red ‘O’ staining. Mice were fed NCD and fasted overnight before sacrifice. Original magnifications: 400x and 40x. fl/fl, floxed control. D) Non-esterified fatty acids levels in freshly drawn blood samples. *, p<0.05 compared with control group. N = 3–7 per group.

