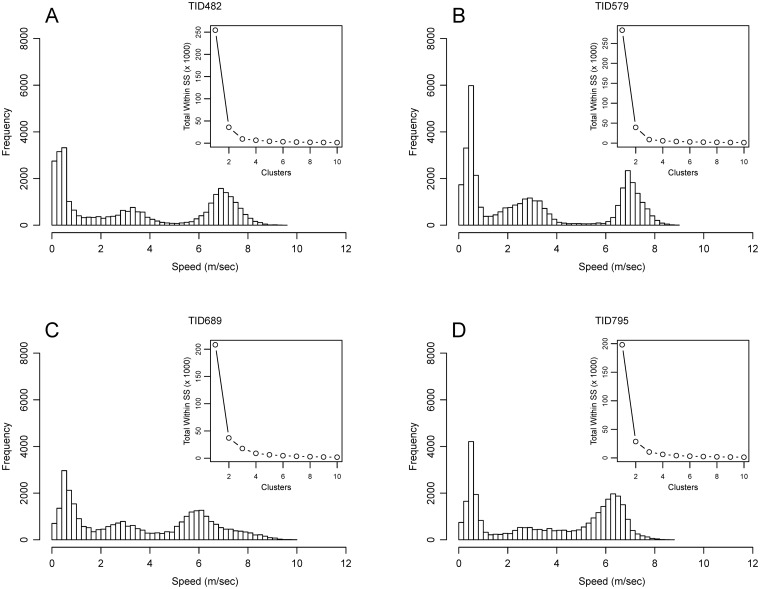
Fig 4. Frequency distribution of speeds.
Plots are for the trips in Fig. 2. Histograms show the tri-model pattern characteristic of all the trips in the sample. The inset scree plots show an inflection point at three groups indicating that fewer clusters have a sharply increased total within sum of squares.

