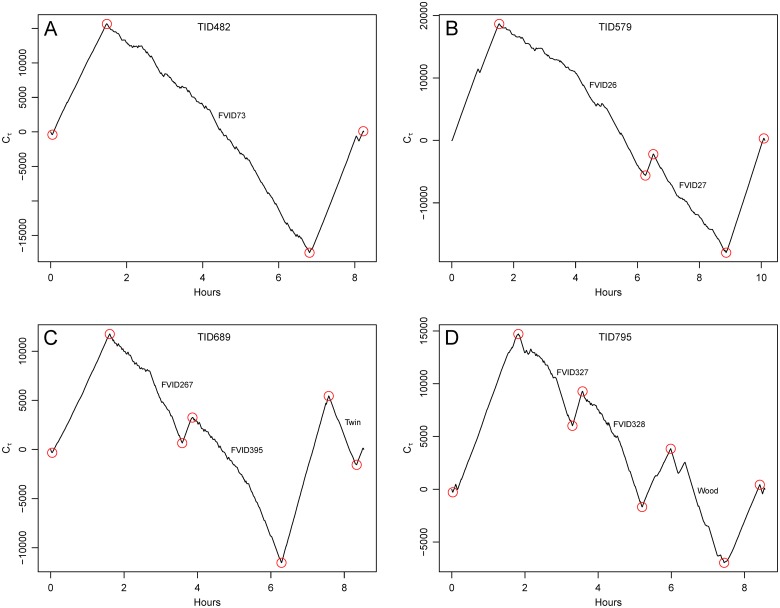
Fig 6. Cumulative sum time series plots generated from Equation 1.
Plots are for the trips in Fig. 2. Local maxima and minima are indicated by the red circles, corresponding to points where the track changes between travel and ARS. Segments with positive slope are all travel. Segments with negative slope are ARS and are annotated to indicate patch type identified by observers during trips. FVID indicates a FAD visit identification number.

