
Figure 2. 5hmC patterns in the renal outer medulla of SS rats.
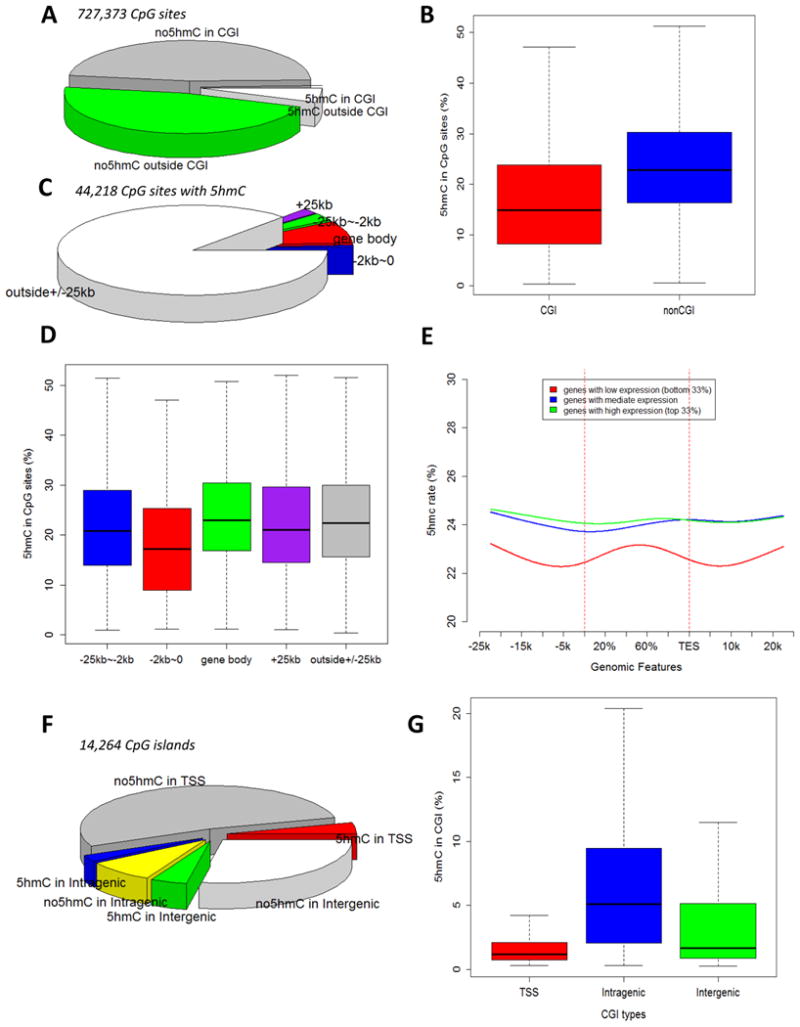
A. Distribution of CpG sites (covered by at least 20 reads) with or without significant 5hmC in and outside of CpG islands (CGI). B. 5hmC rates of CpG sites that contained significant 5hmC. C. Distribution of 5hmC-containing CpG sites relative to gene bodies. D. 5hmC rates of 5hmC-containing CpG sites categorized by their spatial relationship with gene bodies. E. 5hmC rates across gene body and 25 kbp up- or down-stream of gene body and the relationship with mRNA abundance. 5hmC rates were calculated based on CpG sites in 2 kbp windows moving at 100 bp steps. Genes were divided into three groups according to mRNA abundance levels. F. Distribution of CpG islands with or without significant 5hmC in transcription start site (TSS +/- 1 kbp), intragenic, and intergenic regions. G. 5hmC rates of CpG islands located in the three regions.