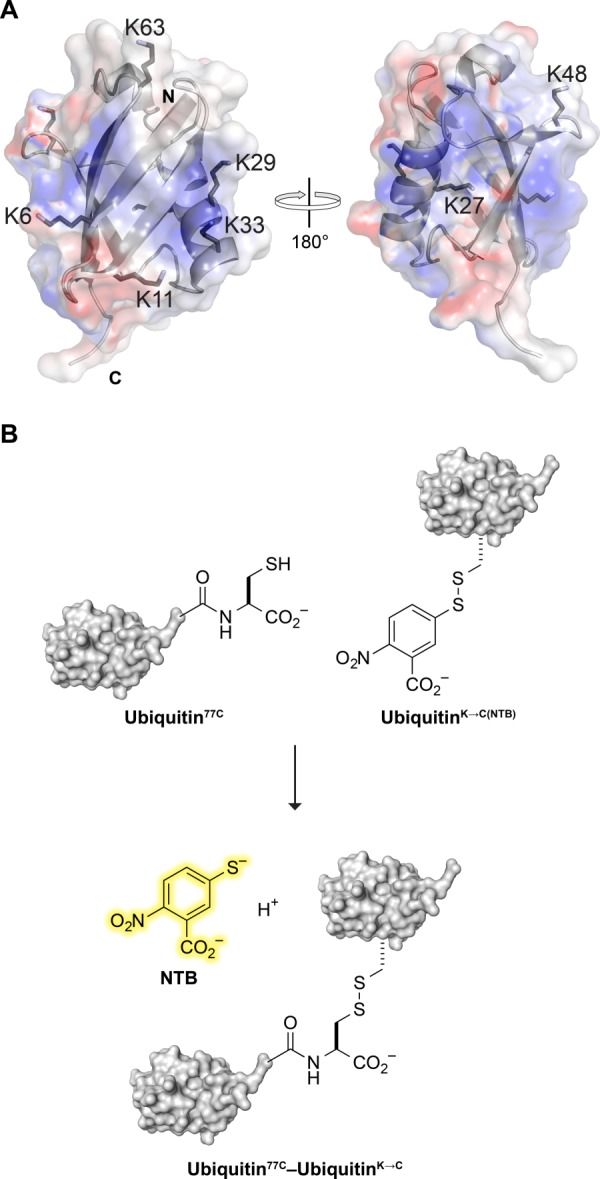
Figure 1.

Ubiquitin dimer formation. (A) Ribbon diagram of ubiquitin showing the location of its 7 lysine residues and N-and C-termini. The translucent surface depicts electrostatic potential (blue: positive; red: negative). The image was created with the program PyMOL and PDB entry 1ubq.45 (B) Scheme for a chromogenic assay of ubiquitin dimer formation. Thiol–disulfide interchange between a ubiquitin variant with a C-terminal cysteine residue and an NTB mixed disulfide of a K→C ubiquitin variant releases NTB.
