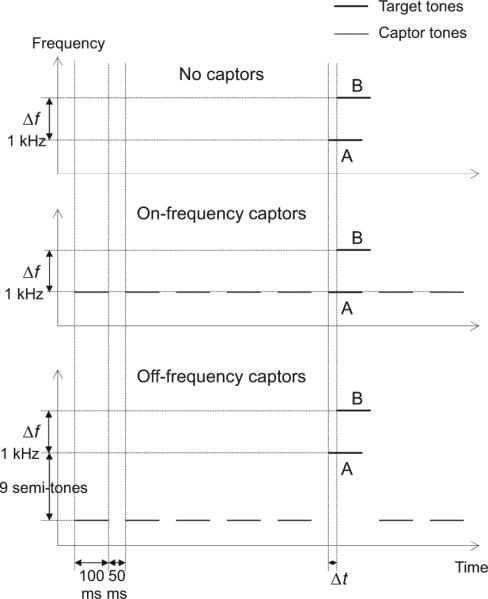
Figure 1.

Schematic spectrogram of the stimuli in Experiment 1. The target A and B tones are indicated by letters. The delay between the A and B tones, Δt, was the tracking variable. Only the case in which the B tone lagged the A tone is illustrated in the figure. The A-tone frequency was fixed at 1 kHz. Two frequency separations between the A and B tones, Δf, were tested: 6 and 9 semitones. Depending on the condition, the target tones were presented in isolation (no-captor condition, shown in the upper panel) or preceded and followed by captor tones, the frequency of which was either the same frequency as the target A tone (on-frequency captor condition, shown in the middle panel) or nine semitones lower (off-frequency captor condition, shown in the lower panel).
