
Figure 3.
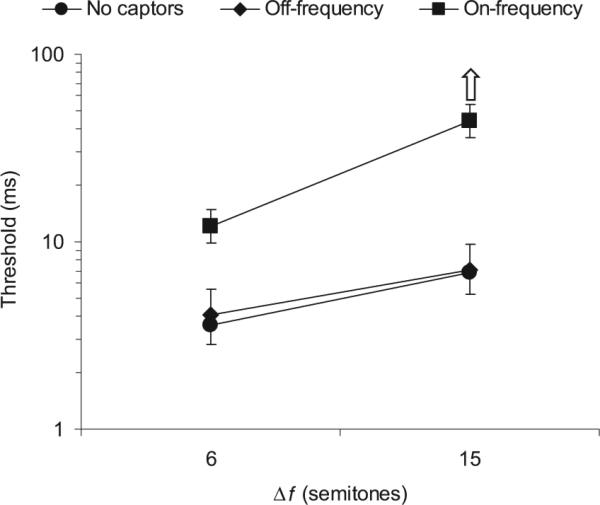
Results of Experiment 2: Influence of on- and off-frequency captor tones on thresholds for the detection of an asynchrony. Each data point represents a mean threshold across 8 listeners. The error bars reflect interparticipant standard errors; upper or lower bars are omitted wherever necessary to avoid overlap. The different symbols denote different captor conditions, as indicated in the legend at the top of the plot: Circles represent no captors, diamonds represent off-frequency captors, squares represent on-frequency captors. The frequency separation in semitones, Δf, between the two target tones is shown on the x-axis.