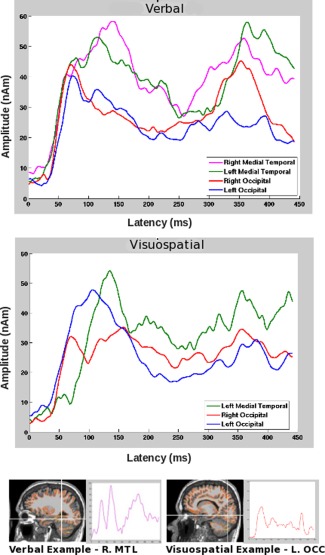
Figure 5.

Top: Averaged time courses across common locations for subjects who used each strategy. Bottom: MRIs (radiological convention) displaying locations of activation (white crosshairs) are shown for two representative individuals, one who used a verbal strategy (left) and the other who used a visuospatial strategy (right), along with the associated time courses for these cortical regions. Note these are the same two individuals for which measured, modeled, and residual waveforms were shown in Figure 3.
