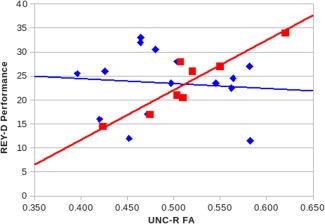
Figure 6.

Correlations between FA values in UNC‐R white matter tract and performance on REY‐D complex figure. Squares = visuospatial group, r = 0.92. Diamonds = verbal group, r = −0.09. [Color figure can be viewed in the online issue, which is available at http://wileyonlinelibrary.com.]
