

Abstract
Two of the most widely measured compounds in the urine of people who use tobacco products are cotinine, a major metabolite of the addictive constituent nicotine, and 4-(methylnitrosamino)-1-(3-pyridyl)-1-butanol (NNAL), a metabolite of the powerful lung carcinogen 4-(methylnitrosamino)-1-(3-pyridyl)-1-butanone (NNK). Thousands of analyses have been reported in the literature, carried out exclusively, to the best of our knowledge, by separate methods. In the study reported here, we have developed a sensitive, accurate, and precise liquid chromatography-electrospray ionization-tandem mass spectrometry-selected reaction monitoring method for the combined analysis of total cotinine (the sum of cotinine and its glucuronide) and total NNAL (the sum of NNAL and its glucuronide). The new method quantifies naturally occurring [13C]cotinine to minimize problems associated with the vast differences in concentration of total cotinine and total NNAL in urine. This method should greatly facilitate future determinations of these important compounds.
In spite of their widely known adverse health effects, tobacco products continue to be a major cause of disease and death, with the average annual smoking-attributable mortality for the United States for 2010–2014 estimated at 500 000 premature deaths, while worldwide the total number of deaths attributable to tobacco use was approximately 6 million.1,2 It does not seem that the worldwide use of tobacco products will diminish significantly in the near future. Two of the most important compounds in tobacco products are nicotine, its major known addictive constituent responsible in large measure for maintenance of the tobacco habit, and 4-(methylnitrosamino)-1-(3-pyridyl)-1-butanone (NNK), a powerful lung carcinogen in laboratory animals which is widely viewed as one of the most dangerous compounds in tobacco products with respect to lung cancer etiology3−6 (see structures in Figure 1). The uptake of these compounds by people who use tobacco products or are exposed to secondhand smoke has been extensively studied by quantifying two characteristic urinary metabolites: cotinine, a major metabolite of nicotine, and 4-(methylnitrosamino)-1-(3-pyridyl)-1-butanol (NNAL), a metabolite of NNK (Figure 1). These metabolites occur in urine partially as glucuronide conjugates and are often measured after treatment of the urine with β-glucuronidase, thus giving “total cotinine” and “total NNAL.” Total cotinine and total NNAL, which are virtually unique to users of tobacco products and related materials, or people exposed to secondhand tobacco smoke, are excellent indicators of tobacco dose and are directly associated with lung cancer risk in smokers.7 The literature contains data on total cotinine and total NNAL in urine samples from many thousands of people.3,6,8−17
Figure 1.

Structures of nicotine, NNK, cotinine, NNAL, and the internal standards used in the analysis.
Current methodology for quantitation of urinary cotinine and NNAL (free or total) is based almost exclusively on tandem mass spectrometry. As far as we are aware, all studies reported to date, regardless of methodology, have measured urinary cotinine and NNAL separately.3,6,8−17 The use of separate methods presumably is related in part to the huge difference in concentrations of total cotinine versus total NNAL in urine. Typical average total cotinine concentrations in urine are about 5000–15 000 times greater than those of total NNAL, which can introduce problems associated with dynamic range. In the study reported here, we have solved this problem by analyzing for naturally occurring total [13C]cotinine, thus developing what is apparently the first combined method for analysis of total NNAL and total cotinine in urine.
Materials and Methods
Materials
Cotinine, [13CD3]cotinine, NNAL, and [13C6]NNAL (Figure 1) were procured from Toronto Research Chemicals (Ontario, Canada). Recombinant β-glucuronidase (catalog # G8295) was purchased from Sigma-Aldrich (Milwaukee, WI). True Taper 96-well plates for sample processing and analysis were from Analytical Sales & Services (Pompton Plains, NJ) while silicone cap mats used to cover the 96-well plates were purchased from Phenomenex (Torrance, CA). Four hundred microliter Isolute SLE+ diatomaceous earth solid-phase extraction 96-well plates were from Biotage (Charlotte, NC) while Oasis MCX 10 mg, 30 μm solid-phase extraction 96-well plates were from Waters (Milford, MA). A Cerex 96-well positive pressure processor (Chromtech, Apple Valley, MN) was utilized during sample processing. Dulbecco’s PBS was purchased from Invitrogen (Grand Island, NY), and the rest of the chemicals were obtained from either Fisher Scientific (Fairlawn, NJ), Sigma-Aldrich (Milwaukee, WI), or Alfa Aesar (WardHill, MA) and used without further purification unless otherwise noted. An Eppendorf multichannel pipettor was used during sample processing.
Urine Samples
The urine samples were obtained from ongoing studies of the University of Minnesota Tobacco Research Programs, approved by the University of Minnesota Institutional Review Board, code number 0908M70881. Two types of urine samples were used in the validation studies. The pooled smokers’ urine sample was obtained by combining urine from 8 subjects, each of whom smoked about 20 cigarettes per day, and contributed between 150 and 320 mL from a 24 h urine collection. The pooled smokeless tobacco users’ urine sample was obtained by combining 1 mL each of urine samples from 68 subjects who used an average of 3.68 tins of smokeless tobacco per week. Upon validation of the method, urine samples from 85 smokers were used to compare the results for total cotinine and total NNAL from the new combined method to those from previously existing methods.
Combined Analysis of Total Cotinine and Total NNAL in Urine
Urine samples that were previously frozen at −20 °C were thawed at 4 °C overnight, and 250 μL aliquots were added to 96-well plates. [13CD3]cotinine (110 pmol) and [13C6]NNAL (0.93 pmol) were dissolved in 50 μL of pH 7.4 phosphate buffered saline (4.24 mM KH2PO4, 620.7 mM NaCl, 11.86 mM Na2HPO4) and added to each well along with 3000 units of β-glucuronidase in 50 μL of pH 7.4 phosphate buffered saline (1.06 mM KH2PO4, 155.2 mM NaCl, 2.97 mM Na2HPO4). The plates were capped with silicone cap mats and incubated in a shaking water bath at 37 °C overnight.
The mixtures in the 96-well plates were transferred onto Isolute SLE+ 96-well plates. A short mild burst of N2 was used to push the liquid mixture through the frits. The aqueous solution was allowed to absorb onto the diatomaceous earth for 5 min and then eluted 6 times, each with 0.3 mL of CH2Cl2. After all the eluents were collected through gravity in a True Taper collection plate, the remainder of the material in the Isolute SLE+ 96-well plates was eluted with the aid of a Cerex-processor and a slow stream of N2. The combined eluents were then dried under vacuum in a SpeedVac for 1–1.5 h.
The samples were further purified by a second solid-phase extraction using Oasis MCX 96-well plates. The dried samples were reconstituted in 250 μL of 1 N HCl by sonication for 15 min. The MCX plates were equilibrated with 1 mL of CH3OH followed by 2 mL of H2O. The reconstituted samples were then added to the MCX plate. The True Taper plate was washed with another 250 μL of 1 N HCl. The MCX plates were then successively washed with 250 μL each of 1 N HCl, CH3OH, and 90:5:5 H2O/CH3OH/NH4OH (v/v/v). The analytes were collected by elution with 35:60:5 H2O/CH3OH/NH4OH (v/v/v) and dried under vacuum in a SpeedVac overnight. Samples were stored at −20 °C until analysis and then dissolved in 50 μL of 5 mM NH4OAc; 8 μL of each sample was analyzed.
LC-ESI+-MS/MS was performed with an Ultra triple quadrupole mass spectrometer (Thermo Scientific, Pittsburgh PA) interfaced with a Waters Nano Acquity HPLC system. Chromatographic separation was achieved using a Luna C18 (2) 5 μ, 150 × 0.5 mm column (Phenomenex) eluted at a flow rate of 10 μL/min at 40 °C. The HPLC solvents were 15% CH3CN in H2O (v/v, solvent A) and CH3CN (solvent B). Isocratic elution with 10% solvent B/90% solvent A for 8 min was used to quantify the analytes. Cotinine and [13CD3]cotinine eluted at 5.12 min while NNAL and [13C6]NNAL eluted at 5.46 min. A column wash was incorporated after every eighth sample, using 10% B/90% A for 10 min followed by an increase to 100% B in 1 min and then isocratic elution with B for 4 min. Then, the column was equilibrated with 10% B/90% A for 5 min. The transitions monitored were m/z 178.08 → m/z 98.14 for cotinine, m/z 181.12 → m/z 102.09 for [13CD3]cotinine; m/z 210.13 → m/z 93.16 (quantifier) and m/z 210.13 → m/z 180.20 (qualifier) for NNAL; m/z 216.14 → m/z 98.14 and m/z 216.14 → m/z 186.18 for [13C6]NNAL. The m/z 178.08 ion monitored for cotinine is the [M + H]+ ion resulting from naturally occurring [13C]cotinine. Typical spray voltage was 2.5 kV, and a capillary temperature of 270 °C was used. Typical tube lens offset values were 67 V for cotinine and 60 V for NNAL. N2 was used as the sheath gas (25 counts). Quantitative analyses were conducted in the SRM mode, with collision energy of 16 V for cotinine and 9 and 17 V for NNAL. Ar was the collision gas with a pressure of 1.1 mTorr. MS/MS analyses were performed using a scan width of m/z 0.2 and a scan time of 0.125 s. Quadrupole resolution was achieved with Q1 set at m/z 0.5 and Q3 set at m/z 0.7.
Accuracy and Precision
Accuracy of the cotinine analysis was determined by spiking a pooled urine sample from 8 smokers, which contained 20.8 nmol total cotinine/mL urine, with cotinine at concentrations of 5.1, 10.1, 20.2, 40.4, or 80.9 nmol/mL urine, and carrying out the analysis. Similarly, a pooled urine sample from 68 smokeless tobacco users containing 21.4 nmol total cotinine/mL urine was spiked with cotinine at concentrations of 5.1, 10.1, 20.2, 40.4, or 80.9 nmol/mL urine. For NNAL, the same urine sample from smokers, which contained 1.8 pmol/mL total NNAL, was spiked with NNAL at concentrations of 0.1, 0.2, 0.4, 0.8, and 1.6 pmol/mL urine while that from smokeless tobacco users, which contained 3.3 pmol/mL total NNAL, was spiked with 2.8, 4.2, 5.6, 8.4, and 14.0 pmol/mL urine.
Precision was determined by replicate analysis of these urine samples with no addition of cotinine or NNAL. Six replicates were carried out for the urine samples from smokers and 3 for those from smokeless tobacco users. Each replicate analysis was carried out on 3 separate days.
Method Comparison
The results of the new method were compared to those obtained upon analysis of the same samples by traditional separate methods, as described previously for total NNAL11 and total cotinine.17
Results and Discussion
The analytical method is summarized in Scheme 1. [13CD3]cotinine and [13C6]NNAL (Figure 1) were used as internal standards. Urine samples were partially purified by successive solid-phase extractions using diatomaceous earth and mixed mode cation exchange-reverse phase 96-well plates. The appropriate fraction was analyzed by LC-ESI-MS/MS. A key feature of this method for analysis of cotinine was monitoring of the m/z 178.08 peak of cotinine, which is the [M + H]+ ion of naturally occurring [13C]cotinine, comprising 11% of the [12C]cotinine [M + H]+ ion. This strategy resulted in an approximate 20-fold decrease in the cotinine signal, diminishing problems associated with the large difference in concentrations of total cotinine and total NNAL in each urine sample.
Scheme 1. Outline of the Method for Combined Analysis of Total Cotinine and Total NNAL in Human Urine.

Typical LC-ESI-MS/MS chromatograms of a smoker’s urine sample are illustrated in Figure 2A–D. Figure 2A,C shows the peaks for [13C]cotinine and the internal standard [13CD3]cotinine while Figure 2B,D illustrate the corresponding peaks used for quantitation of NNAL and internal standard [13C6]NNAL. For [13C]cotinine, m/z 178.08 is the protonated molecular ion while m/z 98.14 is the pyrrolidinone ion. For NNAL, m/z 210.13 is the protonated molecular ion and m/z 93.16 corresponds to [pyrH–CH2]+. The cotinine peak in Figure 2A was only 7 times greater in intensity than the NNAL peak in Figure 2B. Chromatograms of similar quality were obtained upon analysis of urine samples from smokeless tobacco users. Limits of quantitation were 0.06 pmol/mL urine for NNAL and 0.42 nmol/mL urine for cotinine.
Figure 2.

Representative LC-MS/MS chromatograms obtained upon analysis of a pooled smokers’ urine sample for total cotinine and total NNAL. Panels A and B, analytes; Panels C and D, internal standards.
Accuracy was determined by adding various amounts of cotinine or NNAL to urine samples from smokers and smokeless tobacco users and performing the assay. As illustrated in Figure 3A–D, there was a linear relationship between added and observed amounts. For cotinine, the y-intercept was 20.9 nmol/mL in urine samples from smokers (Figure 3A), consistent with the 20.8 nmol/mL amount determined in these samples when no cotinine was added. The average accuracy, determined by comparing added and measured amounts at each level of addition, was 99.2%. The corresponding figure for urine samples from smokeless tobacco users (Figure 3B) shows a y-intercept of 21.5 nmol/mL versus a level of 21.4 nmol/mL when no cotinine was added and an average accuracy of 98.7%. For total NNAL in smokers’ urine, the y-intercept (Figure 3C) gave a value of 1.84 pmol/mL compared to an expected value of 1.8 pmol/mL, and the average accuracy was 98.3%; while in the urine from smokeless tobacco users (Figure 3D), the y-intercept was 3.15 compared to an expected value of 3.3 pmol/mL, and the average accuracy was 98.1%.
Figure 3.

Accuracy results for total cotinine in the urine of smokers (Panel A) and smokeless tobacco users (Panel B) and total NNAL in the urine of smokers (Panel C) and smokeless tobacco users (Panel D). Increasing amounts of cotinine or NNAL were added to the urine samples which were analyzed by the new combined method. The y-intercept represents the amount present in each pooled sample before addition of cotinine or NNAL.
Precision was determined by replicate analyses of the urine samples at zero spiked level, 6 replicates from smokers and 3 from smokeless tobacco users, analyzed once per day over 3 days. Intraday and interday precision (coefficient of variation, in %) for cotinine in smokers’ urine were 1.2% and 1.1%, respectively, while the corresponding figures in smokeless tobacco users’ urine were 0.7% and 0.6%. For total NNAL, intraday and interday precision were 4.4% and 2.7% in smokers’ urine and 0.8% and 0.9% in smokeless tobacco users’ urine. Average levels of total cotinine and total NNAL in these samples were 20.9 nmol/mL and 1.6 pmol/mL urine, respectively, in smokers’ urine and 21.5 nmol/mL and 2.8 pmol/mL, respectively, in smokeless tobacco users’ urine.
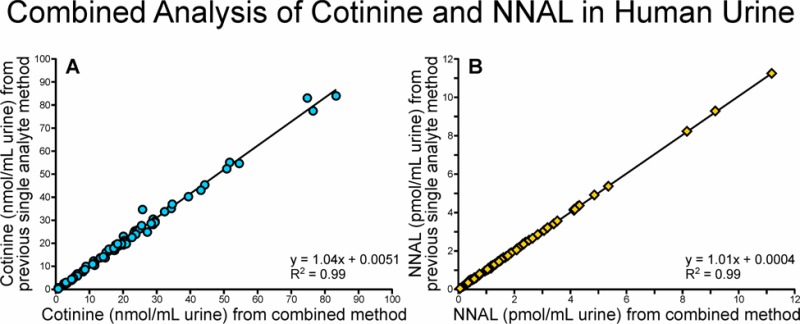
The new combined method was further validated by comparing the results to those obtained by the traditional separate methods for analysis of total cotinine and total NNAL in urine samples from 85 smokers. The results, which are presented in Figure 4A,B, show excellent correlation between the data from the traditional and new methods.
Figure 4.

Comparison of data obtained upon analysis of total cotinine (panel A) and total NNAL (panel B) in the urine of 85 smokers by the traditional separate methods and the combined method.
The results presented here constitute, to the best of our knowledge, the first report in the literature of a combined method for quantitation of total cotinine and total NNAL in the urine of people who use tobacco products. The method could also be adapted to studies quantifying these metabolites in the urine of nonsmokers exposed to secondhand smoke. Our solution to the problem of a huge dynamic range, which can inhibit quantitation of both of these important compounds, was to decrease the sensitivity of cotinine detection by analysis of naturally occurring [13C]cotinine in the samples. The resulting method has great accuracy and precision and compares favorably to previous separate methods for determination of these important metabolites. This innovative method will facilitate analysis of total cotinine and total NNAL as well as decrease the cost of these analyses by about 30% in future studies of uptake of the important compounds nicotine and NNK in people who use tobacco products.
Acknowledgments
This study was supported by Grants CA-138338 and CA-81301 from the U.S. National Cancer Institute. Mass spectrometry was carried out in the Analytical Biochemistry Shared Resource of the Masonic Cancer Center, supported in part by National Cancer Institute Cancer Center Support Grant CA-77598. We thank Alberto Dalmasso for technical assistance and Bob Carlson for editorial assistance.
The authors declare no competing financial interest.
Funding Statement
National Institutes of Health, United States
References
- United States Department of Health and Human Services The Health Consequences of Smoking: 50 Years of Progress. A Report of the Surgeon General; U.S. Department of Health and Human Services, Centers for Disease Control and Prevention, National Center for Chronic Disease Prevention and Health Promotion, Office on Smoking and Health: Atlanta, GA, 2014. [Google Scholar]
- Stewart B. W.; Wild C. P.. World Cancer Report 2014, IARC: Lyon, FR, 2014. [Google Scholar]
- IARC Monogr. Eval. Carcinog. Risks Hum. 2004, 83, 33–1187. [PMC free article] [PubMed] [Google Scholar]
- IARC Monogr. Eval. Carcinog. Risks Hum. 2007, 89, 41–583. [PMC free article] [PubMed] [Google Scholar]
- Hecht S. S. Chem. Res. Toxicol. 1998, 11, 559–603. [DOI] [PubMed] [Google Scholar]
- Hukkanen J.; Jacob P. III; Benowitz N. L. Pharmacol.Rev. 2005, 57, 79–115. [DOI] [PubMed] [Google Scholar]
- Yuan J.-M.; Gao Y.-T.; Murphy S. E.; Carmella S. G.; Wang R.; Zhong Y.; Moy K. A.; Davis A. B.; Tao L.; Chen M.; Han S.; Nelson H. H.; Yu M. C.; Hecht S. S. Cancer Res. 2011, 71, 6749–6757. [DOI] [PMC free article] [PubMed] [Google Scholar]
- Lee P. N. In Analytical Determination of Nicotine and Related Compounds and Their Metabolites; Gorrod J. W., Jacob P. III, Eds.; Elsevier: Amsterdam, 1999; pp 669–719. [Google Scholar]
- Benowitz N. L.; Dains K. M.; Dempsey D.; Wilson M.; Jacob P. Nicotine Tob. Res. 2011, 13, 772–783. [DOI] [PMC free article] [PubMed] [Google Scholar]
- Jacob P. III; Yu L.; Duan M.; Ramos L.; Yturralde O.; Benowitz N. L. J. Chromatogr., B: Anal. Technol. Biomed. Life Sci. 2011, 879, 267–276. [DOI] [PMC free article] [PubMed] [Google Scholar]
- Carmella S. G.; Ming X.; Olvera N.; Brookmeyer C.; Yoder A.; Hecht S. S. Chem. Res. Toxicol. 2013, 26, 1209–1217. [DOI] [PMC free article] [PubMed] [Google Scholar]
- Hecht S. S. Carcinogenesis 2002, 23, 907–922. [DOI] [PubMed] [Google Scholar]
- Shah K. A.; Karnes H. T. Crit. Rev. Toxicol. 2010, 40, 305–327. [DOI] [PubMed] [Google Scholar]
- Xia Y.; Bernert J. T.; Jain R. B.; Ashley D. L.; Pirkle J. L. Biomarkers 2011, 16, 112–119. [DOI] [PubMed] [Google Scholar]
- Roethig H. J.; Munjal S.; Feng S.; Liang Q.; Sarkar M.; Walk R. A.; Mendes P. E. Nicotine Tob. Res. 2009, 11, 1216–1225. [DOI] [PubMed] [Google Scholar]
- Vogel R. I.; Carmella S. G.; Stepanov I.; Hatsukami D. K.; Hecht S. S. Biomarkers 2011, 16, 491–497. [DOI] [PMC free article] [PubMed] [Google Scholar]
- Murphy S. E.; Park S.-S. L.; Thompson E. F.; Wilkens L. R.; Patel Y.; Stram D. O.; Le Marchand L. Carcinogenesis 2014, 35, 2526–2533. [DOI] [PMC free article] [PubMed] [Google Scholar]