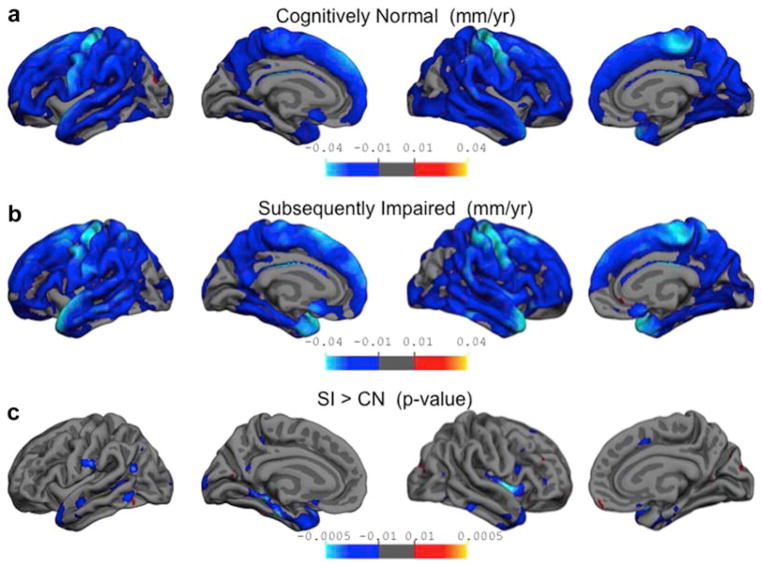
Figure 2.
Differential rates of cortical thinning.
Whole brain analyses were conducted to determine the rates of cortical thinning in both CN and SI groups. The top two panels depict the actual rate of annual thinning as determined from Equation 1, adjusted for baseline age and sex of participants. The resulting maps have been thresholded to display values between 0.01 and 0.04 mm per year. The bottom panel depicts the regions where rates of cortical thinning are significantly different between the two groups. The resulting t-values have been thresholded to corresponding significant p-values between 0.01 and 0.00005. Panel a: Rates of cortical thinning, in mm per year, are shown for the CN group. Widespread cortical thinning can be seen throughout the frontal, parietal and temporal lobes with rates of 0.05–0.01 mm lost per year (shown in darker blue). The biggest changes are seen along the precentral gyrus, with rates equivalent to about 0.04 mm lost per year (shown in cyan). Panel b: Shows the rate of cortical thinning for the SI group. For this group the biggest changes are seen along the precentral gyrus and superior temporal gyrus with rates equivalent to about 0.04 mm lost per year (shown in cyan).
Panel c: Shows the significant differences in the annual rates of cortical thinning for the SI group compared to the CN group. The biggest differences in the rates are seen along the parahippocampal gyrus and temporal pole, showing that the SI group is thinning at a rate about a 0.01 mm per year faster than the CN group.

