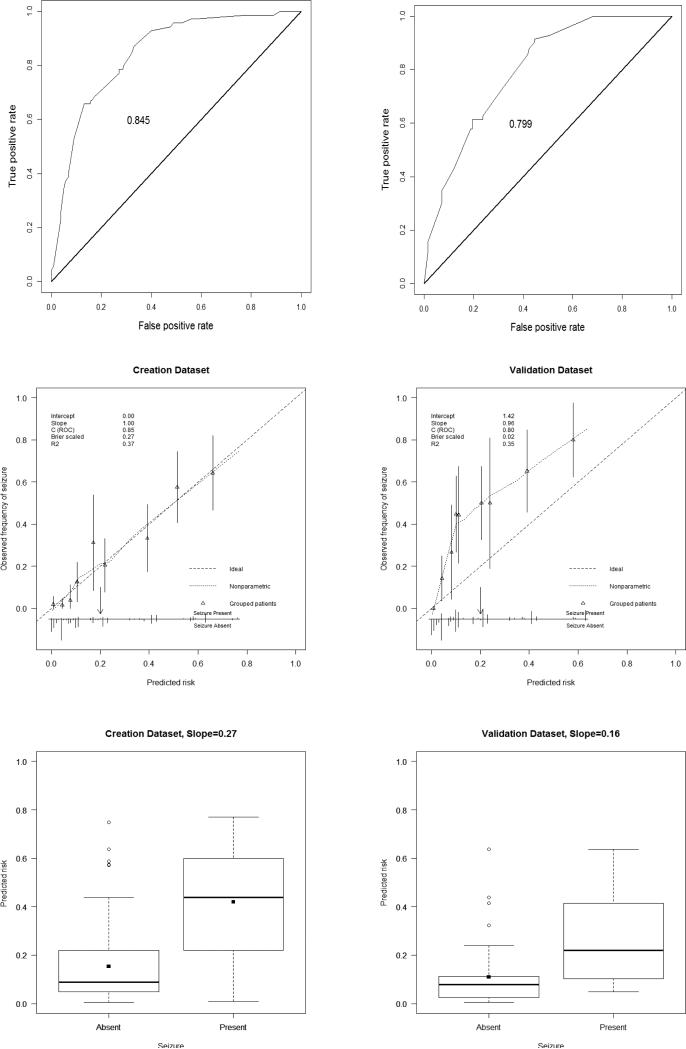
Figure 1.
Characteristics are provided for the creation (left) and validation (right) datasets.
Top. Receiver operating characteristic (ROC) curves.
Middle. Validation plots of prediction model for residual masses in creation data and validation data. Calibration is shown with a non-parametric line (dot). Distribution of the predicted probabilities and 95% confidence intervals are indicated by groups of patients (triangles with vertical line) and for individual patients (vertical lines). Vertical lines upwards represent patients with seizures; lines downwards represent patients without seizures. The threshold value was chosen to be 20% (downwards arrow).
Bottom. Box plots of predicted probabilities in creation and validation datasets. Group means are displayed as filled squares. Points outside 1.5 interquartile ranges are displayed as unfilled circles.

