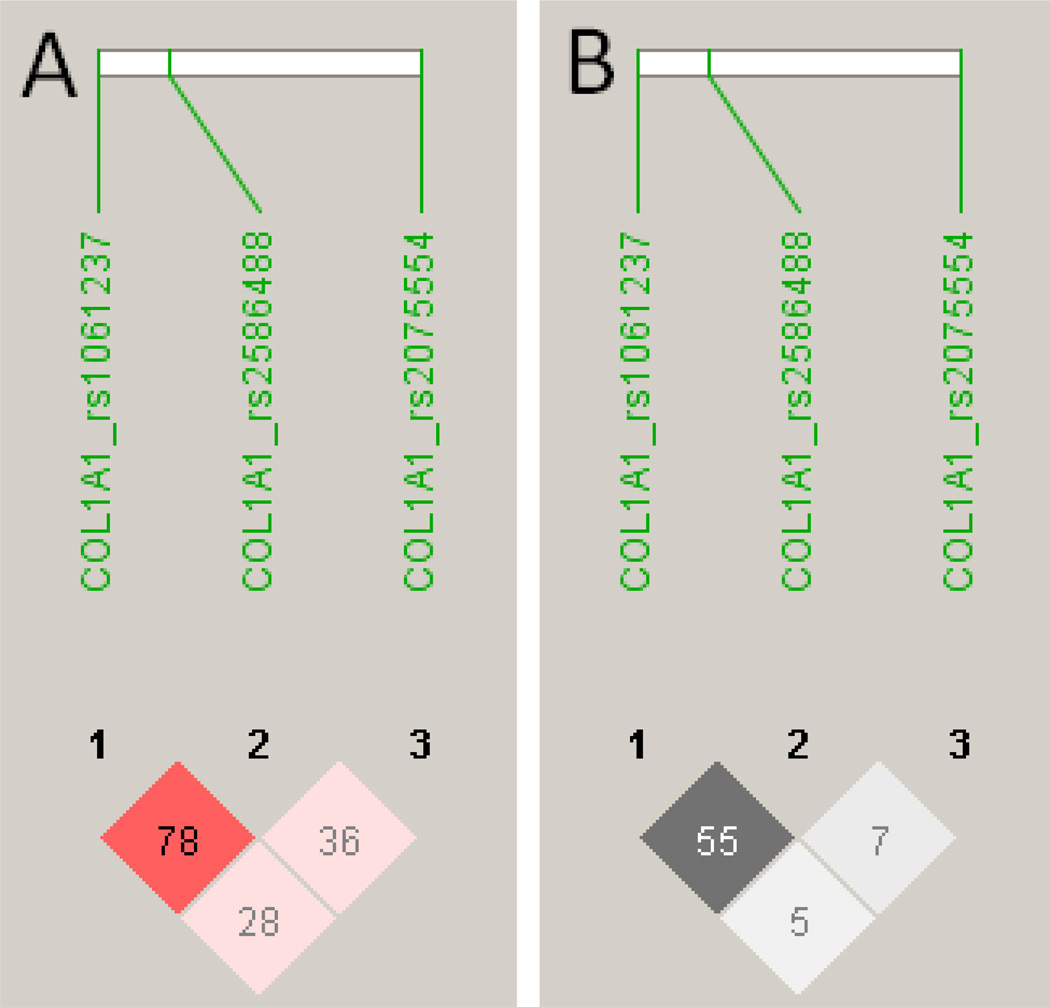
Figure 1.
LD patterns for D’ (A) and r2 (B) were determined in Haploview software v4.2 (Barrett et al., 2005) for the 3 COL1A1 SNPs used in the association analyses. D' values and confidence levels (LOD) are represented as red for D'=1, LOD>2 (none present); shades of pink for varying D’, LOD<0.2; white for D'<1, LOD<2 (none present). r2 values are represented white for r2 = 0, with intermediate values for 0<r2 < 1 indicated by shades of grey. The numbers within the squares represent the D' or r2 scores for pairwise LD.

