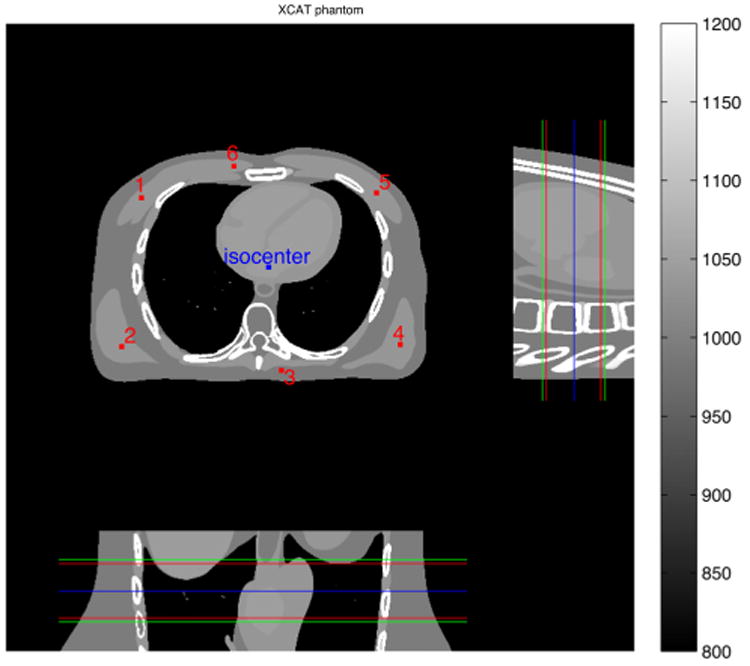
Fig. 1.

XCAT phantom used in the simulation. Middle 3 planes (xy, xz, and yz planes through the isocenter) are shown. Red and blue dots indicate locations of the added impulses and the isocenter, respectively. Red lines indicate our axial ROI, which is from 5th to 60th slices (out of 64). Blue line displays the location of the center slice. Finally, green lines show the detector coverage.
