
Fig. 4.
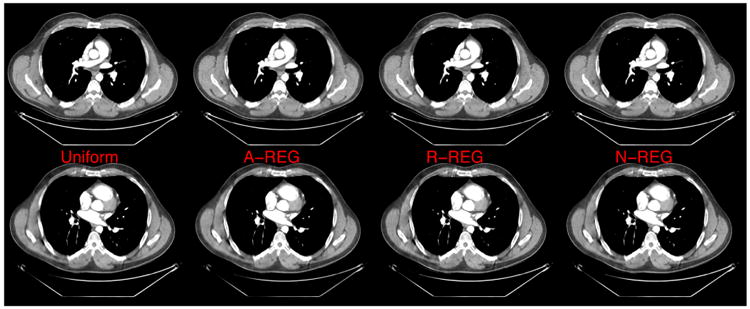
Reconstructed images using uniform regularizer (1st column), A-REG (2nd column), R-REG (3rd column), and N-REG (last column). Quadratic potential function was used. Top row: center slice; bottom row: the last slice of ROI. Display range is [800 1200] (HU).