
Fig. 7.
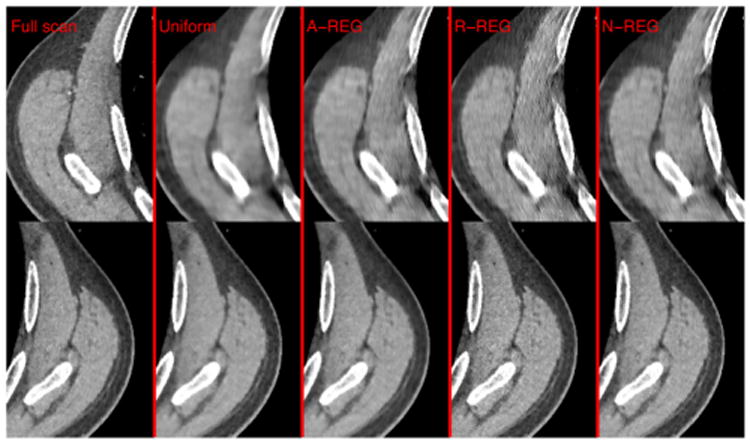
Comparison of reconstructed images in Fig. 6 at the last slice of ROI. From left to right, the images are from full scan measurements with A-REG, uniform regularizer, A-REG, R-REG, and N-REG, respectively. Top row is from a region on the left side where sampling is lower than a region on the right side (bottom row). Display range is [800 1200] (HU).