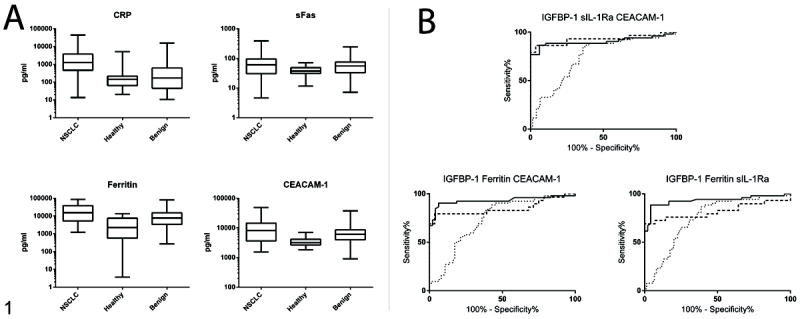
Figure 1. Top performing urine biomarkers and multimarker panel.

A. Box and whisker plots of top performing urine biomarkers. Levels of 235 urine biomarkers were measured in NSCLC patients (n=54), Healthy (n=49) and Benign (n=74) controls. Biomarkers demonstrating the strongest performance in the classification of cases vs. controls are shown. Boxes represent median with 25th and 75th percentiles. Whiskers represent maximum and minimum values. B. ROC analysis of selected multimarker panels. Performance of the top three 3-biomarker combinations in the classification of NSCLC patients from Healthy and Benign controls. Solid line: NSCLC vs Healthy training set; dashed line: NSCLC vs Healthy validation set; dotted line: NSCLC vs Benign.
