Figure 7.

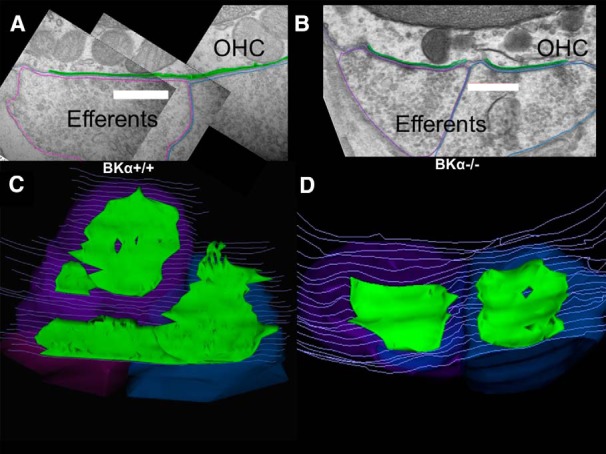
Ultrastructure of efferent synapses in BKα+/+ and BKα−/− mice. A, Cross section showing vesicle-rich efferent terminals contacting an OHC in the basal cochlea of wild-type mouse. The synaptic cisterns are outlined in green, efferent terminals in purple and blue, and hair cell membrane in gray. Scale bar, 500 nm. B, Cross section of two efferent contacts on an OHC in the basal cochlea of a BKα−/− mouse. Cisterns outlined in green and efferent terminals in purple and blue. Scale bar, 500 nm. C, Z-axis projection (tilted ∼45 degrees forward from plane of section) of 3D reconstruction of 37 serial sections including that in A. D, Z-axis projection (tilted ∼30 degrees forward from plane of section) of 3D reconstruction of 21 serial sections including that in B.
