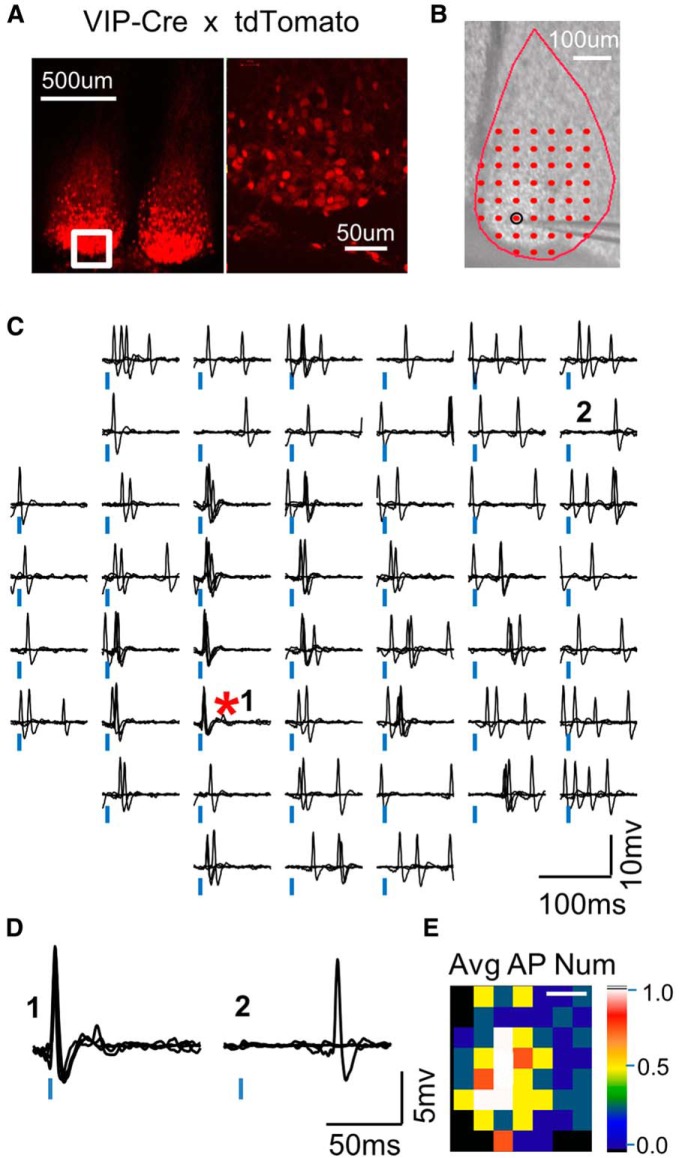
Figure 1.
An example of the excitability spatial profile of a VIP+:ChR2+ neuron obtained using LSPS. A, VIP-Cre mice were crossed to tdTomato reporter mice (Ai9; Madisen et al., 2010) to reveal the spatial profile of VIP-expressing neurons in the SCN ventral core. B, The slice image has marks for the laser stimulation positions (red dots) and the soma location (black circle). The recording pipette can be seen. Scale bar, 100 μm (same for all map images and color maps in subsequent figures). C, An example map of evoked action potentials. The traces represent the responses to laser application at each stimulus position (100 μW). Vertical blue bars mark the onset of laser application. The red asterisk marks the stimulus position closest to the soma. D, Examples of responsive (1) and unresponsive (2) locations in the map in C. E, The color map derived from C plotting the average number of action potentials evoked per trial at each location.

