Figure 2.
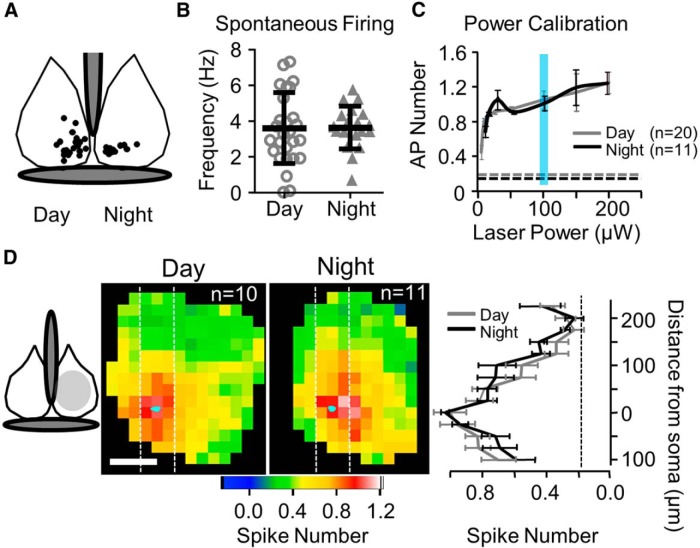
No change in spontaneous firing or excitability spatial profiles for VIP+ neurons between day and night. A, Locations of VIP+ neuron somata that underwent cell-attached recordings. Day and night recordings are depicted in separate SCNs only for illustrative purposes. Gray marks the third ventricle (above) and optic chiasm (below). B, Spontaneous firing frequency is unchanged between day and night. C, The number of evoked action potentials as a function of laser power is plotted. For each cell, only the location where the highest number of action potentials was evoked was analyzed (the best location). The blue vertical bar indicates the standard 100 μW power used in most experiments. The dashed gray and black horizontal lines indicate the baseline signals for day and night, respectively, which are based on the spontaneous firing rates. D, Average excitability profiles during the day and night are plotted as color maps aligned to soma location for each neuron examined (Materials and Methods). The approximate map area in the averages is indicated in the anatomical map (left, light gray). White dashed vertical lines indicate the analysis column used in the two-dimensional graph (right) where each row of the analysis column was averaged and plotted as a function of vertical distance from the soma. No difference in the distribution or magnitude of evoked action potential number was observed between day and night. Baseline is indicated by the vertical dashed line.

