Figure 5.
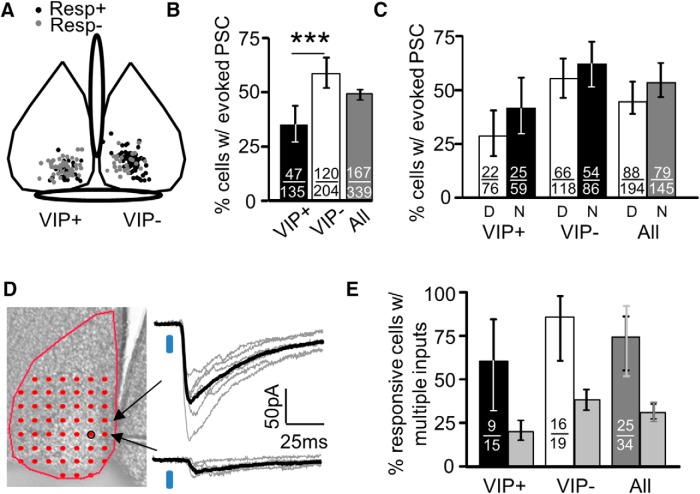
A fraction of neurons displayed functional input from VIP+ neurons. A, The population of responsive (Resp+) and unresponsive neurons (Resp−) overlapped in their locations in the ventral SCN. Postsynaptic neuron subtypes are depicted in separate SCNs for illustrative purposes. Positions are depicted for 90 and 65% of VIP+ and VIP− neurons examined. B, A higher proportion of VIP− neurons displayed optically evoked PSCs compared with VIP+ neurons. C, No difference in the proportion of responsive neurons was observed between day (D) and night (N). D, Responsive neurons typically displayed response successes of differing amplitude indicating multiple presynaptic VIP+ neurons providing input. E, Percentage of responsive neurons where at least two inputs could be detected. Light gray bars depict the expected percentage based on data in B. All error bars span the 95% CI. In All of panel E, the 99% CI is also depicted (light gray). ***p < 0.001.

