
Figure 9.
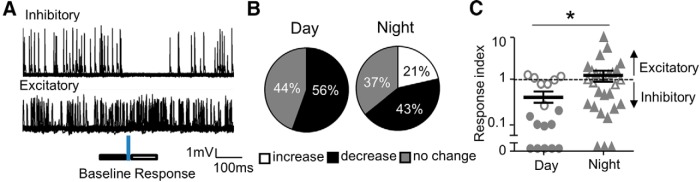
The final effect of VIP+ input is less inhibitory at night at postsynaptic VIP− neurons. A, Individual traces of a cell-attached recordings measuring action potential firing in two different VIP− neurons; one exhibiting an inhibitory response (top) and the other excitatory (bottom). Laser application is denoted by the blue vertical bar and the analysis windows are indicated by solid and empty horizontal bars. B, Day and night distributions of neurons responding to blue light with an increase, decrease, or no detectable change in firing. C, Plots of a response index which is the ratio of action potential number in the response window (A, empty bar) to that in the control window (A, solid bar; n = 18,28). Solid symbols represent neurons that displayed an index statistically different from 1. Indices >1 and <1 indicate excitation and inhibition, respectively; *p < 0.05.