Figure 1.
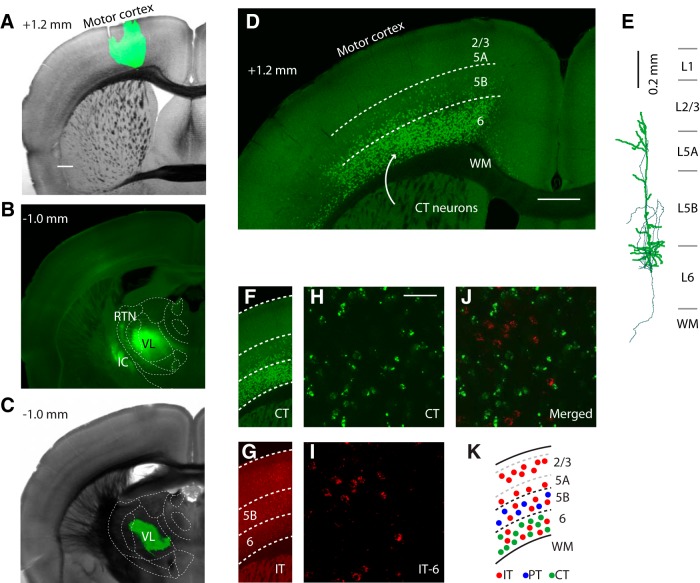
CT neurons are a distinct class of M1 projection neurons intermingled with IT neurons in layer 6. A, Bright-field image of coronal brain slice through M1 with superimposed epifluorescence image showing location of AAV-GFP injection site (green). Scale bar, 0.5 mm. Estimated anterior–posterior distance from bregma is indicated in top left corner. B, Epifluorescence image of the resulting labeling pattern of M1 axons in thalamus. Outlines of thalamic nuclei are based on comparison of bright-field images with reference atlases (Paxinos and Franklin, 2001; Dong, 2008). IC, Internal capsule. C, Bright-field and superimposed epifluorescence image showing the retrograde tracer injection site in VL. D, Confocal image of retrogradely labeled neurons in M1 after tracer injection in VL. WM, White matter. Scale bar, 0.5 mm. E, Reconstruction of a retrogradely labeled neuron. Thin lines are axons. Laminar borders are based on Suter et al. (2013). F, Retrograde labeling pattern of CT neurons (from D). G, Retrograde labeling pattern of IT neurons distributed in layers 2–6 (same slice; red tracer injected in contralateral M1 to label corticocallosal neurons). H, I, Higher-magnification confocal image of labeled CT neurons (H) and IT neurons (I) in layer 6 of M1. Scale bar, 50 μm. J, Merged image. K, Schematic representation of laminar distributions of CT, IT, and PT neurons in M1.

