Figure 2.
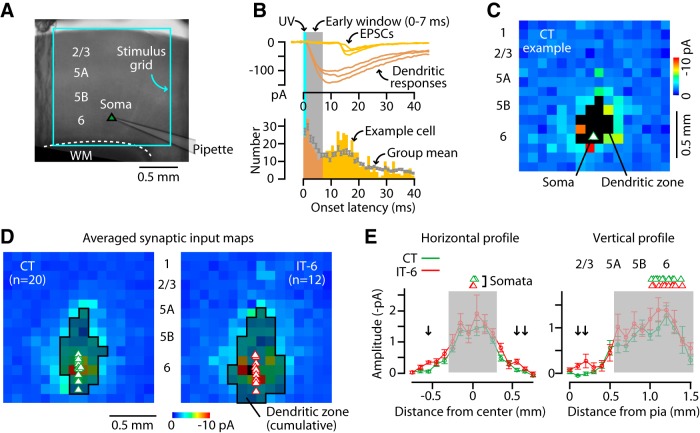
Local excitatory input to M1-CT neurons comes from nearby sites in deeper layers. A, Recording configuration for mapping inputs to CT neurons using glutamate uncaging and laser scanning photostimulation. Bright-field image of M1 viewed with a 4× objective lens showing orientation of the mapping grid. B, Top, Example traces with responses recorded in a CT neuron evoked by focal glutamate uncaging at various sites in the grid. Synaptic inputs (EPSC, yellow traces) arrive with longer latencies than dendritic responses (orange traces). Bottom, Histogram of onset latencies. A 7 ms time window (gray shadow) was used to identify dendritic responses and exclude them from further analysis. C, Example of a CT neuron's excitatory synaptic input map. Pixels represent the mean current amplitude in the poststimulus time interval of 7–50 ms. Black pixels represent the zone of dendritic responses, identified by latency analysis (see B). D, Average synaptic input maps of CT neurons and IT-6 neurons. Shaded pixels (outlined in black) indicate sites where dendritic responses were observed in any of the neurons. E, Horizontal (left) and vertical (right, with layers indicated above plot) profiles of CT (green) and IT-6 (red) synaptic input maps. Arrows indicate significant CT-IT differences (rank-sum test, p < 0.05). Gray shading indicates regions with dendritic responses.

