Figure 3.
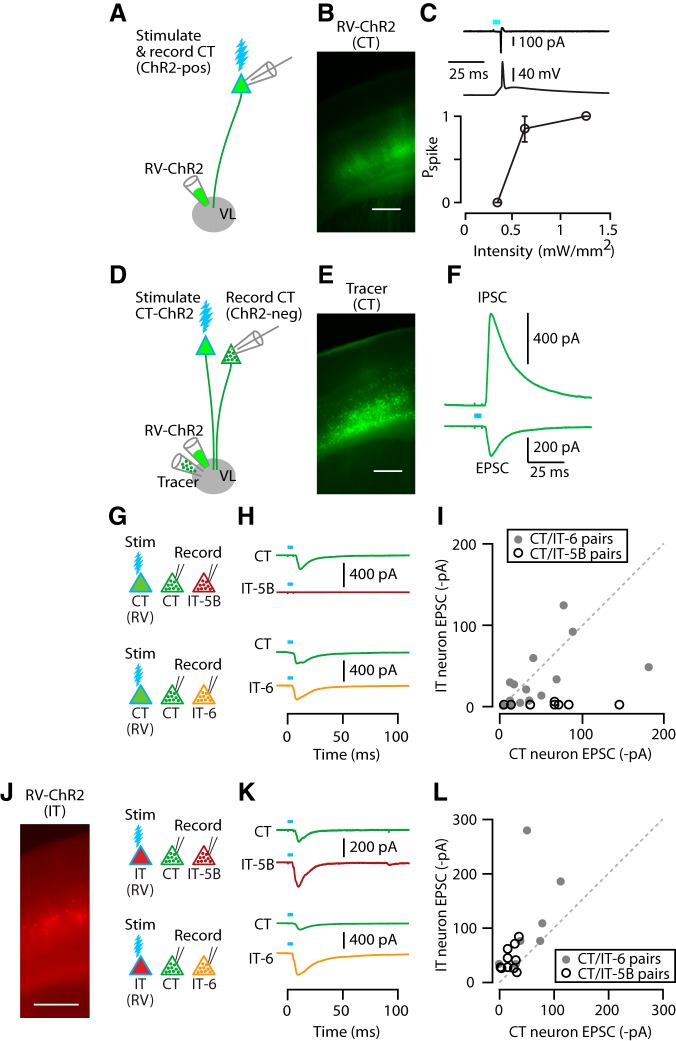
CT and IT neurons are interconnected in a partially layer-specific manner. A, Injection of RV-ChR2 into VL transfects CT neurons for optogenetic photostimulation. B, Epifluorescence image of RV-ChR2-transfected CT neurons in M1. Scale bar, 0.4 mm. C, Example traces of photo-evoked spikes recorded from a ChR2-expressing CT neuron, first in cell-attached (upper) and then whole-cell (middle) configuration. Bottom, Plot of photo-evoked spike probability (Pspike) as a function of light intensity. Stimulation width was 5 ms. D, Injection of both RV-ChR2 and inert retrograde tracer into VL for synaptic connectivity analysis. For simplicity, the double-labeling of many CT neurons is omitted. E, Epifluorescence image of CT neurons labeled with retrograde tracer (CTB647). F, Example traces of a photo-evoked EPSC and IPSC recorded from identified CT neuron. G, Schematic of stimulation/recording configuration. H, Example traces of EPSCs recorded from CT and IT-5B (top) and CT and IT-6 (bottom) neurons upon photostimulation of CT neurons. I, Pairwise comparison of photo-evoked EPSC between CT and IT-5B (open circles) or CT and IT-6 neurons (filled circles). Line indicates unity slope. J, Epifluorescence image (left) and schematic of stimulation/recording configuration (right). Scale bar, 0.5 mm. K, Example traces of EPSCs recorded from CT and IT-5B (top) and CT and IT-6 (bottom) neurons upon photostimulation of IT neurons. L, IT input to CT versus IT neurons, as in I.

