Figure 4.
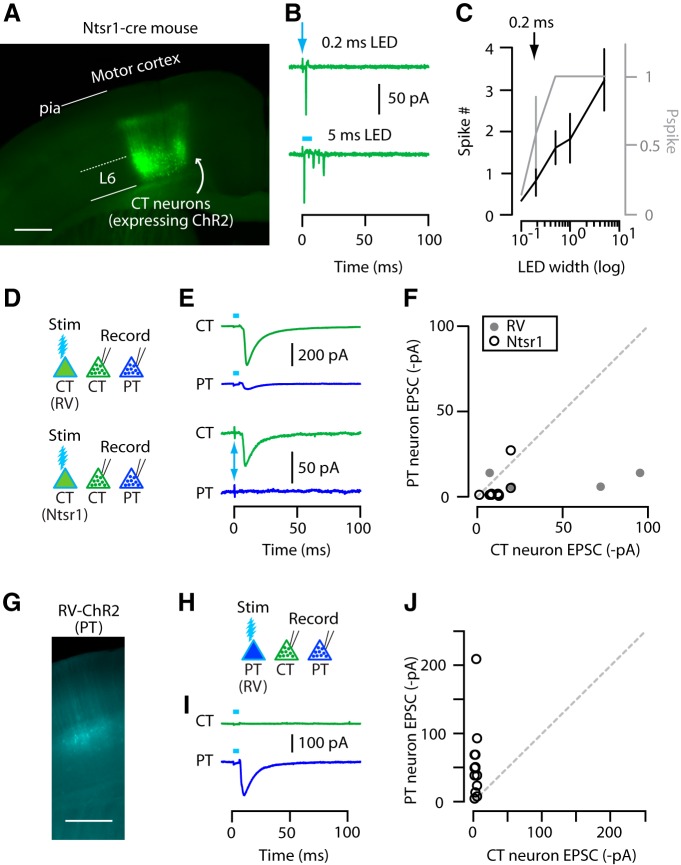
CT and PT neurons are mostly not interconnected. A, Epifluorescence image of CT neurons labeled with ChR2 in M1 near the injection site. Coronal section of Ntsr1-Cre mouse. Scale bar, 0.5 mm. B, Example traces of photo-evoked spikes recorded in cell-attached voltage-clamp mode from Ntsr1-ChR2 CT neurons at two different stimulus durations (0.2 and 5 ms). Arrow marks the 0.2 ms stimulus. C, Average plot showing spike number (black line with scale on the left) and Pspike (gray line with scale on the right) obtained at different photostimulation widths. Arrow marks the stimulus duration that produced similar responses to RV-ChR2 CT neurons. D, Schematic of stimulation/recording configuration. E, Example traces of EPSCs recorded from CT and PT neurons upon photostimulation of RV-ChR2 (top) or Ntsr1-ChR2 (bottom) CT neuron population. F, Pairwise comparison of CT and PT responses to RV-ChR2 (filled circles) and Ntsr1-ChR2 (open circles) CT stimulation. G, Epifluorescence image of RV-ChR2-expressing PT neurons. Scale bar, 0.5 mm. H, Schematic of stimulation/recording configuration. I, Example traces of EPSCs recorded from CT and PT neurons upon photostimulation of PT neuron population. J, PT input to CT versus PT neurons, as in F.

