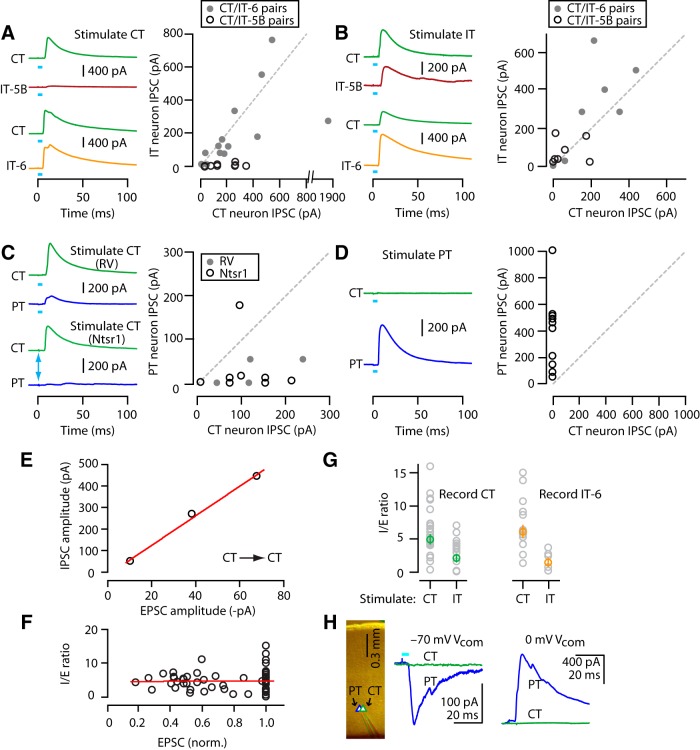
Figure 5.
Disynaptic inhibition (I) parallels excitatory input (E) and I/E ratios are pathway specific. A, Example traces (left) and pairwise comparison of IPSCs recorded from CT and IT-5B (middle) or CT and IT-6 (right) neurons upon photostimulation of CT neurons. B, Plot represented as in A, but for IT neuron stimulation. C, Example traces (left) and pairwise comparison of IPSCs recorded from CT and PT neurons upon photostimulation of CT neurons, for RV-ChR2 (top) and Ntsr1-ChR2 (bottom) photostimulation. Arrow marks the 0.2 ms stimulus used for Ntsr1-ChR2. D, Traces and plot represented as in C, but for PT neuron stimulation. E, Representative plot of EPSC versus IPSC amplitudes for three neurons recorded in the same slice in the RV-ChR2 experiments. Line: linear regression (R2 = 0.99). F, Ratio of IPSC/EPSC plotted against normalized EPSC amplitude per slice. Data points with EPSC amplitudes <15 pA were excluded. Line indicates linear regression (R2 = 0.0003). G, Comparison of I/E ratio for CT (left) or IT-6 (right) neurons when stimulating different presynaptic populations (CT or IT). H, Recordings from a neighboring pair of CT and PT neurons. The PT neuron received strong PT excitation and disynaptic inhibition; the CT neuron received neither.

