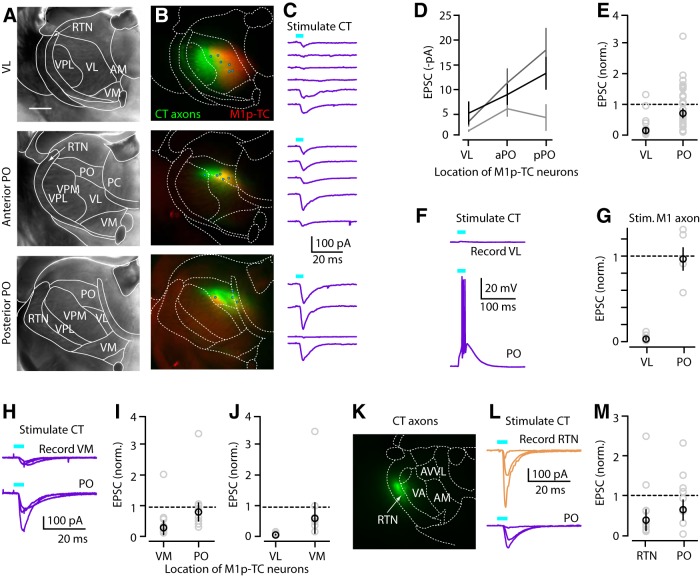
Figure 7.
CT axons only weakly excite TC neurons in VL, but strongly excite thalamic neurons in several other nuclei. A, Bright-field image of coronal section containing VL (top), aPO (middle), and pPO (bottom). Borders of thalamic nuclei were determined as described in Figure 1. Scale bar, 0.5 mm. B, Merged epifluorescence image of CT axons (green) and M1p-TC neurons (red) in the same slices. Circles represent the locations where M1p-TC neurons were recorded in the same slices (total of 15 neurons in this animal). C, EPSC traces from the recorded M1p-TC neurons. Traces in each panel are ordered lateral to medial. Each line represents the set of multiple single-cell recordings obtained from one animal. D, CT input to M1p-TC neurons in VL and anterior and posterior PO. E, Normalized plot of CT input to VL and PO. aPO and pPO data were pooled. Individual EPSCs were divided with mean input to PO. F, Current-clamp traces from M1p-TC neuron in VL and PO of same animal. CT input could evoke spikes in PO but not in VL. G, Same plot as E, but for M1 input to M1p and unlabeled TC neurons. H, EPSC traces from multiple M1p-TC neurons in VM and PO of same animal. I, Normalized plot of CT input to M1p-TC neurons in VM and PO. Values were normalized to mean input to PO. J, Normalized plot of CT input to M1p-TC neurons in VL and VM. Values were normalized to mean input to VM. K, Epifluorescence image of coronal section containing RTN and CT axons (green). L, EPSC traces obtained from multiple neurons in RTN and PO of one animal. M, Normalized pairwise comparison of CT input to neurons in RTN versus M1p-TC neurons in PO.

