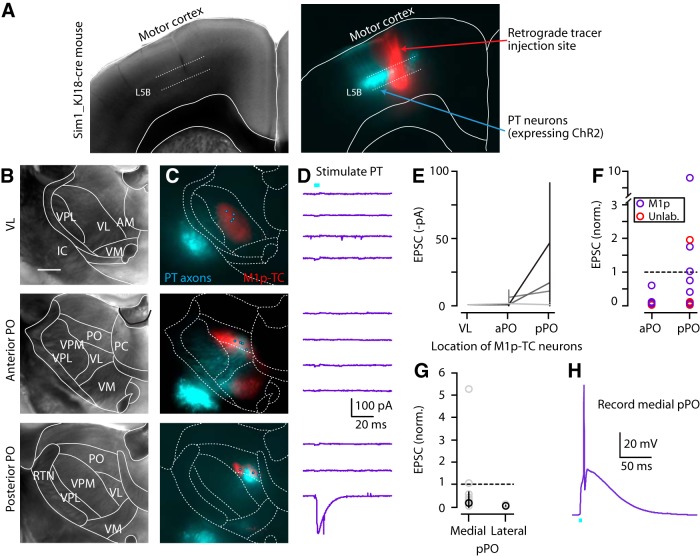
Figure 8.
PT axons excite TC neurons in medial portion of pPO. A, Bright-field (left) and epifluorescence (right) images of a coronal section showing M1 of Sim1_KJ18-Cre mice, with PT neurons (cyan) labeled by injection of Cre-dependent AAV-ChR2 virus injection and also the retrograde tracer injection site (red) in M1 to label TC neurons in the thalamus. B, Bright-field image of coronal section containing VL (top), aPO (middle), and pPO (bottom) of Sim1_KJ18-Cre mice injected with AAV-ChR2 as in A. Borders of thalamic nuclei were determined as described in Figure 1. Scale bar, 0.5 mm. C, Merged epifluorescence image of PT axons (cyan) and M1p-TC neurons (red) in the same slices. Circles represent the locations where thalamic neurons were recorded in the same slices (total of 11 neurons in this animal). D, EPSC traces from the recorded thalamic neurons including M1p-TC and unlabeled neurons. Traces in each panel are ordered lateral to medial. Each line represents the set of multiple single-cell recordings obtained from one animal. E, PT input to M1p-TC neurons in VL and anterior and posterior PO. Note a lack of PT input in VL. F, Normalized plot of PT input to aPO and pPO. Individual EPSCs were divided with mean input to pPO. G, Normalized plot of PT input to thalamic neurons in medial and lateral cluster of M1p-TC neurons in pPO. Individual EPSCs were divided with mean input to pPO. Plot includes unlabeled thalamic neurons. H, Current-clamp traces from M1p-TC neuron in medial pPO. PT input could evoke spikes in this region.

