
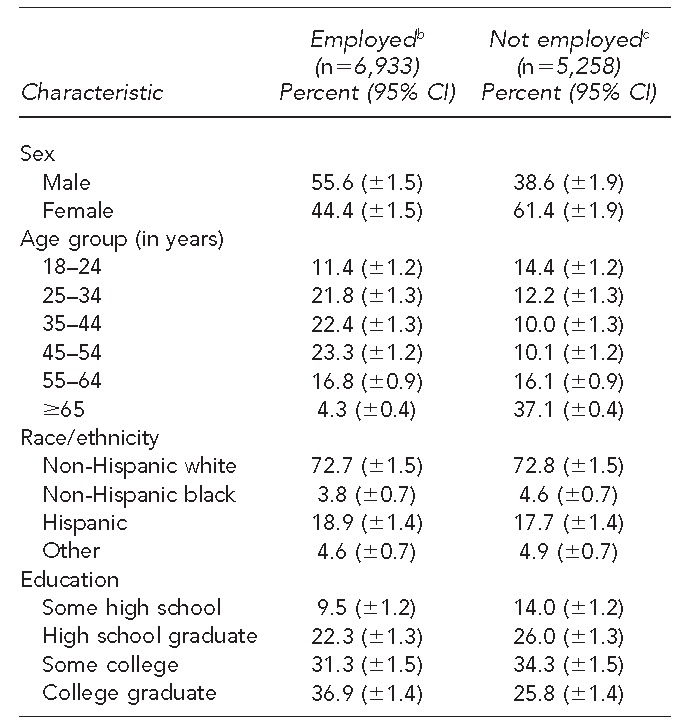
Table 1.
Distribution of demographic characteristics among employed and unemployed adults: Colorado Behavioral Risk Factor Surveillance System, 2012a
a
Source: Health Statistics Section, Colorado Department of Public Health and Environment
bPeople who reported employment status as “currently employed for wages,” “self-employed,” or “out of work for less than one year”
cThe nonworking population is included in this table for comparison.
CI = confidence interval