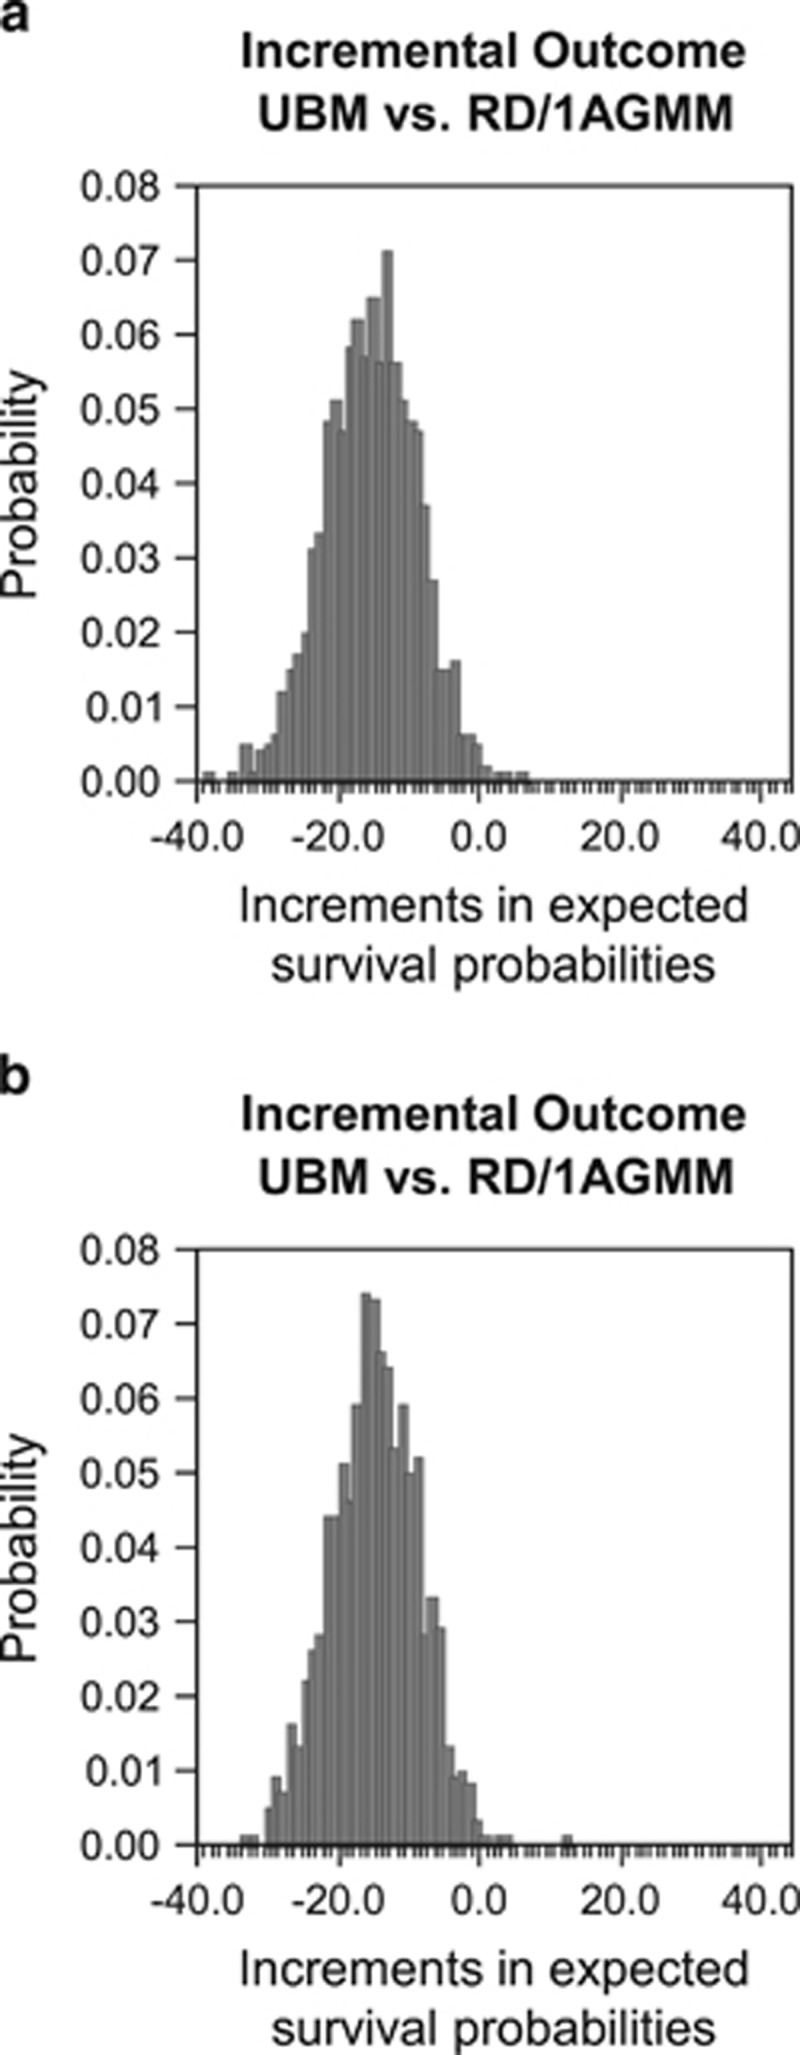
Figure 3.

Probabilistic sensitivity analysis using a Monte Carlo simulation for the AML cohort. A probabilistic sensitivity analysis was performed for AML without (a) or with QOL adjustments. (b) Distributions of increments in the expected survival probabilities (MUD vs RD/1AGMM) in all simulations are shown. MUD, HLA 8 of 8 allele-matched unrelated donor; MV, mean value; RD/1AGMM, related donor with an HLA-1 antigen mismatch in the GVH direction.
