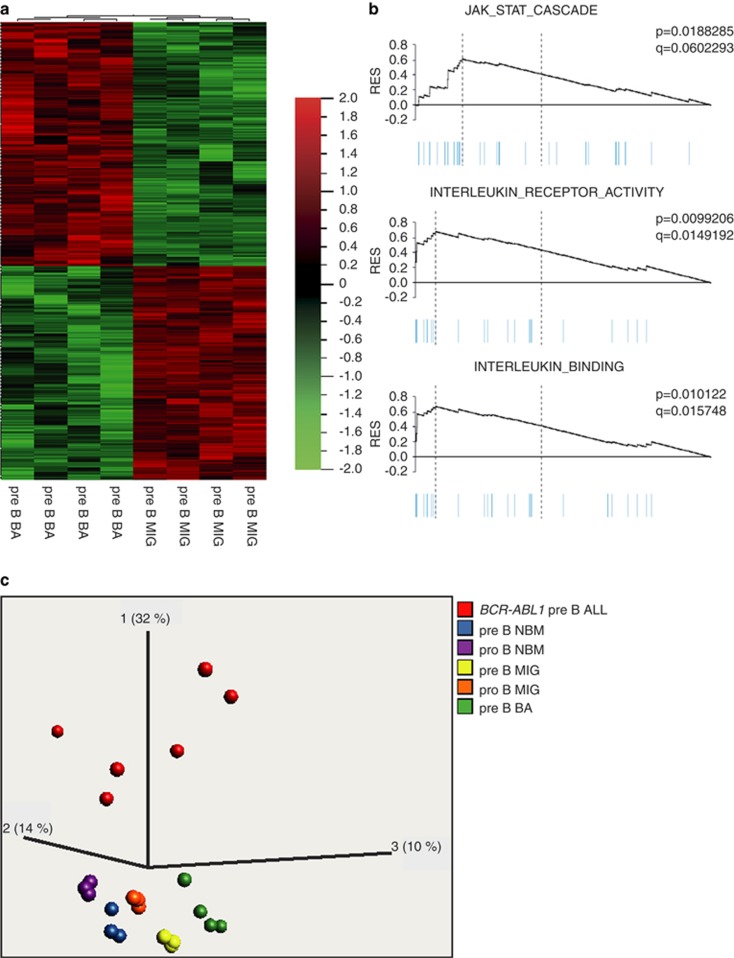
Figure 6.
RNA sequencing shows a change in gene expression profile in BCR-ABL1+ pre-B cells. (a) Heat map of differentially expressed genes from RNA sequencing analysis of pre-B cells from BA and MIG control mice. (b) Gene set enrichment analysis of genes differentially expressed in (a) showing significant enrichment of different gene sets. (c) Using principal component analysis, the gene expression profile from BA and MIG pre-B cells were compared with those of B-cell populations from normal BM and childhood BCR-ABL1+ pre-B ALLs.

