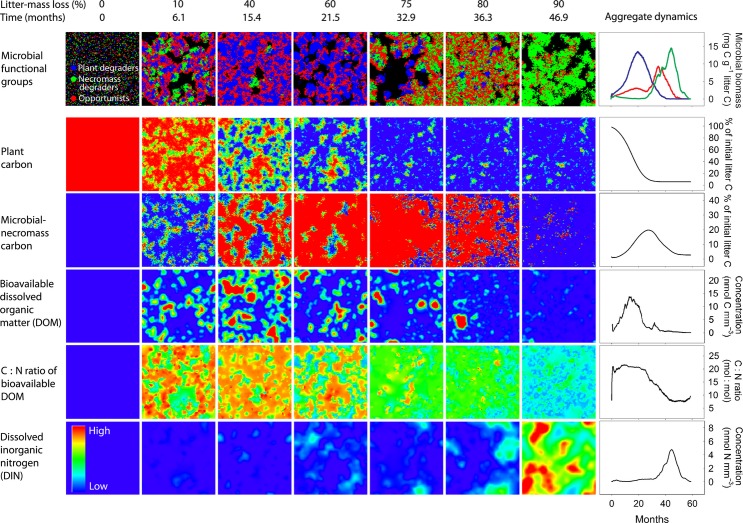
Figure 3.
A closely linked succession of microbial groups and chemical complexity emerges during litter decomposition from individual-based modelling. Each square shows a 100 × 100 grid of microsites, corresponding to a 1 × 1 mm area of leaf litter. The uppermost row displays the spatial distribution of individual microbes of three functional groups (blue: Plant degrader, green: Microbial-necromass degrader, red: Opportunists), whereas rows 2–6 display spatial distribution of complex (plant material, microbial remains) and labile substrate (dissolved organic material, inorganic nitrogen). Relative amounts of each substrate per microsite are indicated by the colour code in the lower left corner. Inserted figures on the right show the aggregated sizes of the respective pools as calculated from the model output. For detailed parameter settings, see Table S1 and main text.

