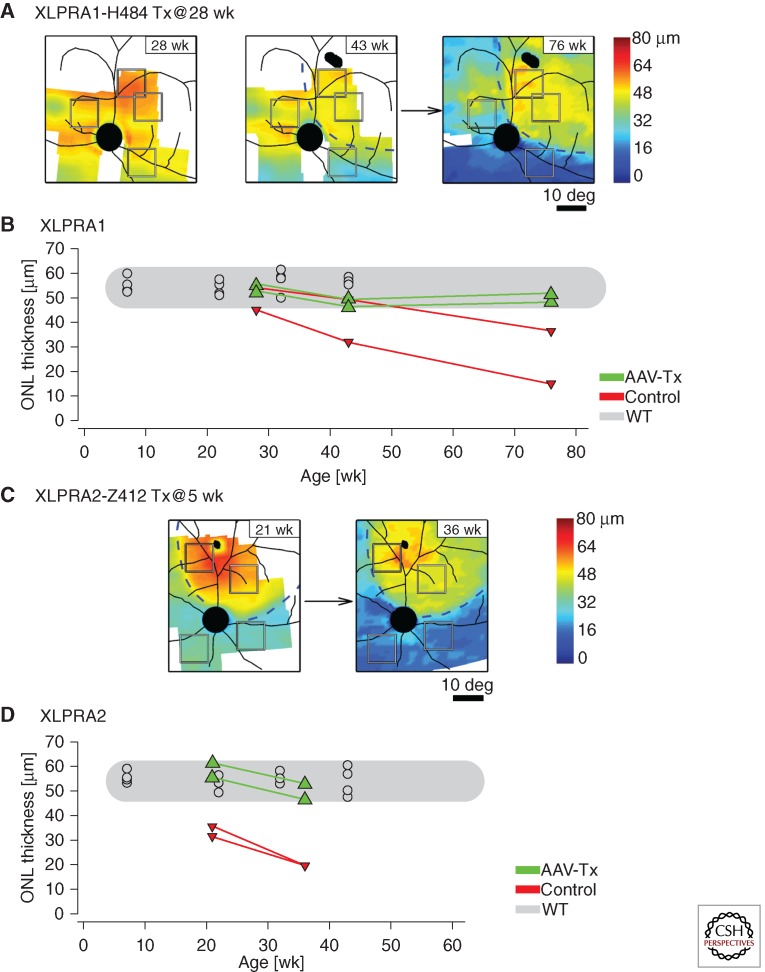
Figure 3.
In vivo retinal imaging of photoreceptor rescue following gene therapy in XLPRA1 and XLPRA2 dogs. Longitudinal follow-up of outer nuclear layer (ONL) thickness changes in eyes of XLPRA1 (H484) and XLPRA2 (Z412) dogs treated with a subretinal injection of AAV2/5-hIRBP-hRPGRex1-ORF15 vector. (A) ONL topography of H484 measured at 28 weeks of age, immediately before the injection, and at 43 and 76 weeks of age corresponding to 15 and 48 wk after the injection, respectively. (B) Progression of ONL thickness at regions of interest within the injection bleb (green symbols) compared with those outside the bleb (red symbols); results from wild-type animals measured at the same retinal locations are also shown (gray symbols). (C) ONL topography of Z412 measured at 21 and 36 weeks of age; injection was performed at 5 weeks of age. (B,D) Progression of ONL thickness at regions of interest within the injection bleb (green symbols) compared with those outside the bleb (red symbols); results from wild-type animals measured at the same retinal locations are also shown (gray symbols). (D) Progression of ONL thickness at regions of interest within the injection bleb (green symbols) compared with those outside the bleb (red symbols); results from wild-type animals measured at the same retinal locations are also shown (gray symbols). Dashed lines in (A) and (C) demarcate the transient blebs created by the subretinal injections; retinal blood vessels and optic nerve are superimposed on the pseudocolor ONL data. Squares in (A) and (C) denote the two regions of interest chosen within the bleb boundary and two regions chosen outside the bleb boundary for the quantitative measures shown in (B) and (C). (Modified from data in Figures 2 and S1 from Beltran et al. 2012).

