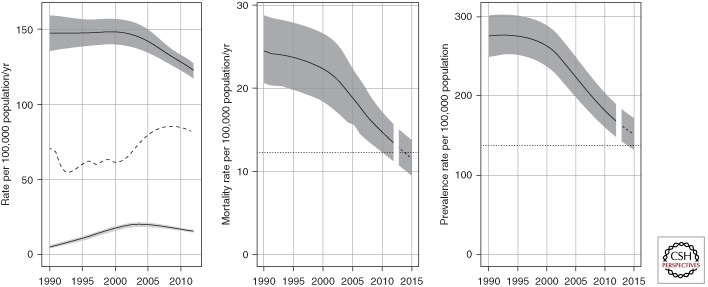
Figure 2.
Global trends in estimated TB incidence and estimated TB mortality. (Left) Global trends in estimated incidence including HIV-negative and HIV-positive TB (dark gray, top) and estimated incidence of HIV-positive TB (light gray, bottom). The dashed line shows global trends in case notification rates (all forms of TB). (Middle) Global trends in estimated TB mortality excluding TB-associated AIDS deaths. The dotted line represents the Stop TB Partnership targets of halving mortality by 2015 compared with the level of 1990. (Right) Global trends in estimated TB prevalence. The dotted line represents the Stop TB Partnership targets of halving prevalence by 2015 compared with the level of 1990. Shaded areas represent uncertainty bands.

