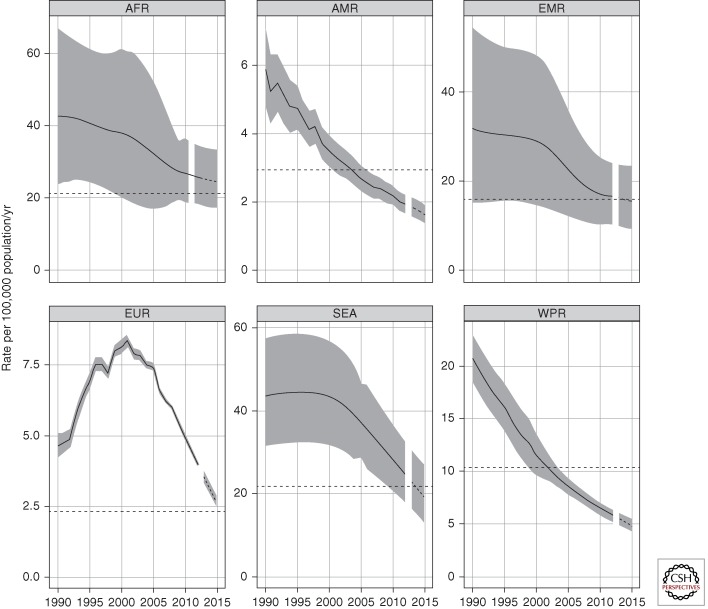
Figure 3.
Trends in estimated TB mortality rates excluding HIV during the period 1990–2012 and forecast TB mortality rates 2013–2015 by WHO region. Estimated TB mortality excludes TB deaths among HIV-positive people (which are classified as AIDS deaths). Shaded areas represent uncertainty bands. The horizontal dashed lines represent the Stop TB Partnership target of a 50% reduction in the mortality rate by 2015 compared with 1990. The other dashed lines show projections up to 2015.

