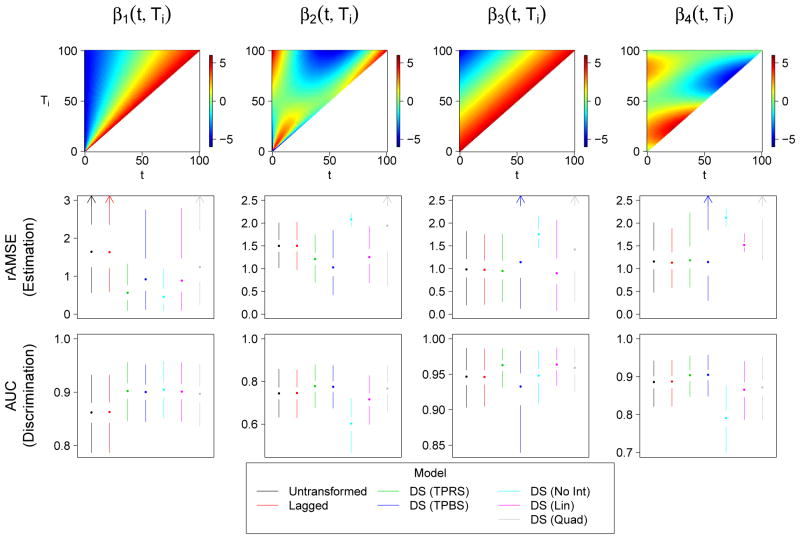
Figure 2.
Simulation results for the case when N = 200, Ti is skewed, measurement error is present, and the outcome is binary. The top row depicts a heat map of the true coefficient functions. The second and third rows depict the root average mean squared error (rAMSE) of β●(t, Ti) and 10-fold cross-validated area under the ROC curve (AUC), respectively, for each of the seven models. Smaller rAMSE and larger AUC indicate better model performance. Results are presented as Tufte box plots, with the median represented by a dot, the interquartile range by the white space around the dot, and the smallest and largest non-outlying points by the endpoints of the lines. Outliers are defined as values not within 1.5 times the interquartile range of the nearest quartile. Arrows indicate lines that extend outside the plotting range.

