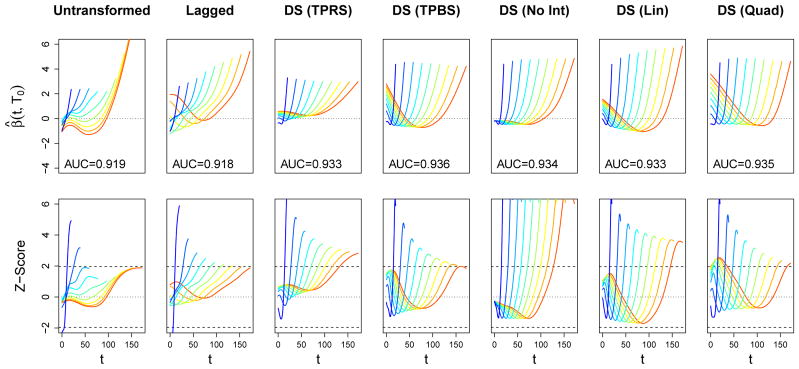
Figure 4.

Estimated coefficient functions for the association between daily SOFA score and in-hospital mortality in the ICAP dataset. Each column corresponds to one of our six functional models. In the top row of plots, estimates are depicted as β● (t, T0) for 10 evenly-spaced values of T0. AUC statistics subject to 10-fold cross-validation are also provided. The bottom row displays the corresponding pointwise Z-scores, β● (t, T0)/SE(β● (t, T0)), as a function of t. The value of T0 is indicated both by color and by the support of each function. The zero line is indicated with a horizontal dotted line, and dashed lines correspond to Z-scores of ±1.96.
