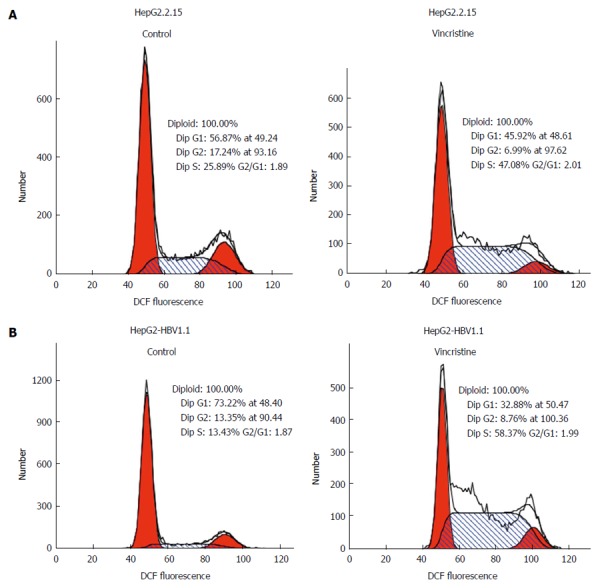
Figure 7.

Diagram of the cell cycle for each phase based on flow cytometry. HepG2.2.15 (4 × 10⁵/well) and HepG2-HBV1.1 (6 × 10⁵/well) cells were treated with vincristine at a concentration of 0.1 μmol/L for 24 h, followed by 48 h of incubation in drug-free culture medium. A: HepG2.2.15 cells; B: HepG2-HBV1.1 cells.
