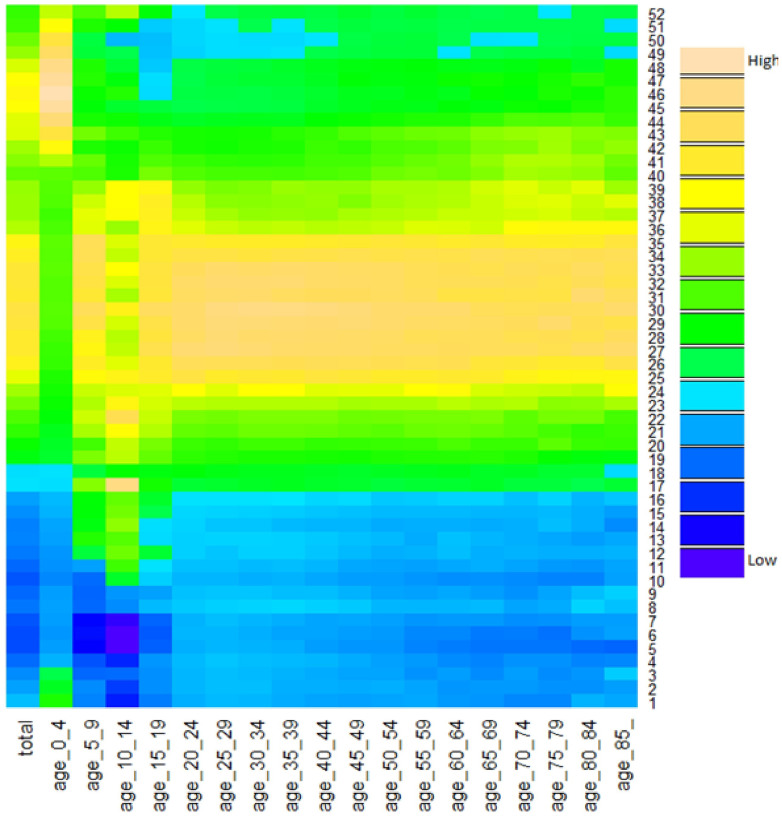
Figure 2. Time series of weekly diarrhoea cases in different age groups of China.
Horizontal line: different age groups, from 0–4 years to > = 85 years; vertical line: week, from week 1 to week 52; colour palette: “High” refers to relatively higher number of diarrhoeal cases within each age group, and “Low” refers to relatively lower number of diarrhoeal cases within each age group.

