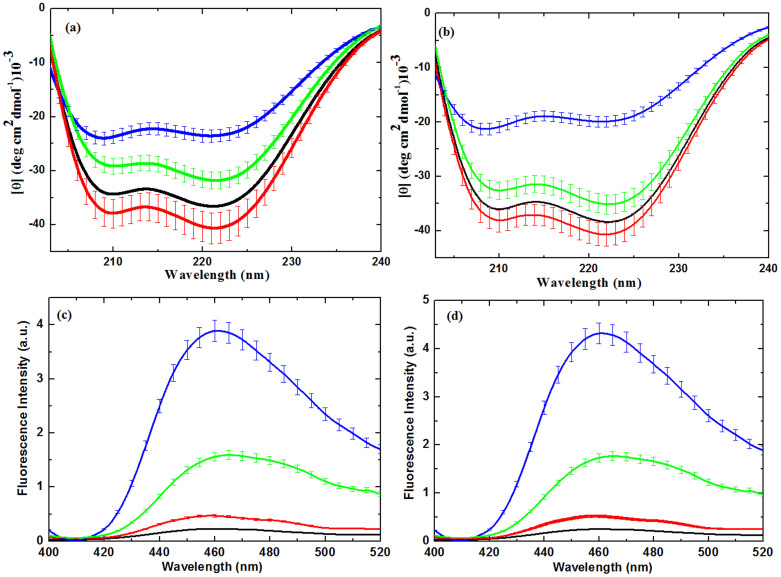
Figure 2.
(a) Far-UV CD spectra analysis of Mb; (b) Far-UV CD spectra analysis of Hb; (c) Fluoresence analysis of Mb and (b) Fluoresence analysis of Hb.Where proteins without treatment (black), proteins treated with Air plasma (red), proteins treated with N2 plasma (blue) and proteins treated with Ar plasma (green).The data points are average values of at least six determinations, the error bars indicating ± mean deviation.

