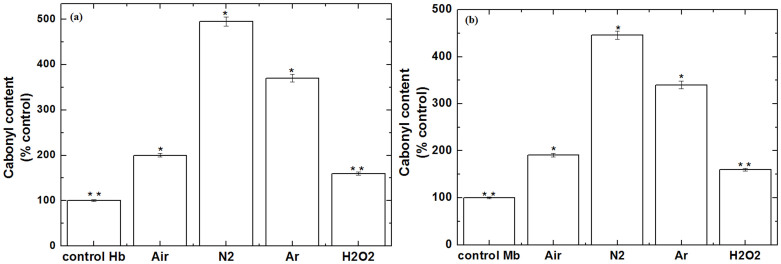
Figure 3. Protein oxidation (carbonyl content) (a) Hb and (b) Mb for proteins, proteins treated with Air plasma, proteins treated with N2 plasma, proteins treated with Ar plasma for 3 min and proteins treated with 60 μM of H2O2.
All values are expressed as ± SD in triplicates. Students't-test was performed to control (*denotes P < 0.05 and ** denotes P < 0.01).

