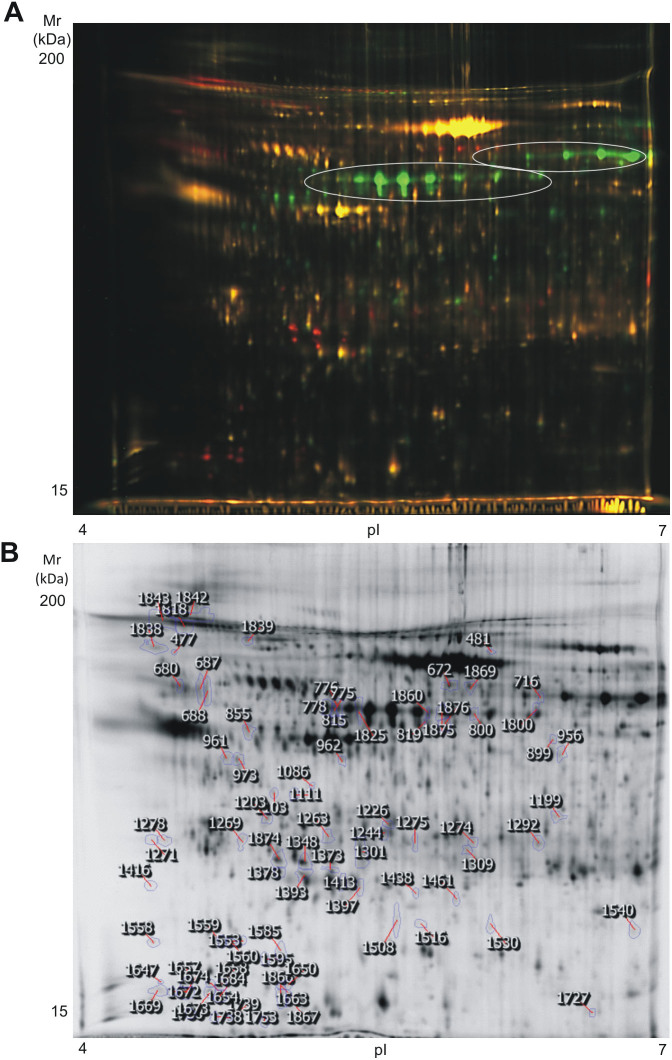
Figure 2. High-resolution 2D-DIGE proteome analysis of platelet releasate from collagen and thrombin stimulated platelets.
Proteins were labeled with the corresponding Cy-dyes (see Methods section) and separated using isoelectric focusing (pH range 4–7, 24 cm) and 11% SDS-PAGE gels. (A) Representative image of the 2D-DIGE analysis where the fluorescence emission from Cy3 and Cy5 dyes is superimposed. Red-orange color spots are augmented in the releasate of thrombin-activated platelets whereas green color spots are augmented in the releasate of collagen-activated platelets. Main fibrinogen arrays are highlighted. (B) Representative image of the analysis in a gray scale with the differentially regulated spots (excluding fibrinogen) highlighted. Further information about protein identifications can be found in Table 1 and Supplementary Table 1.

