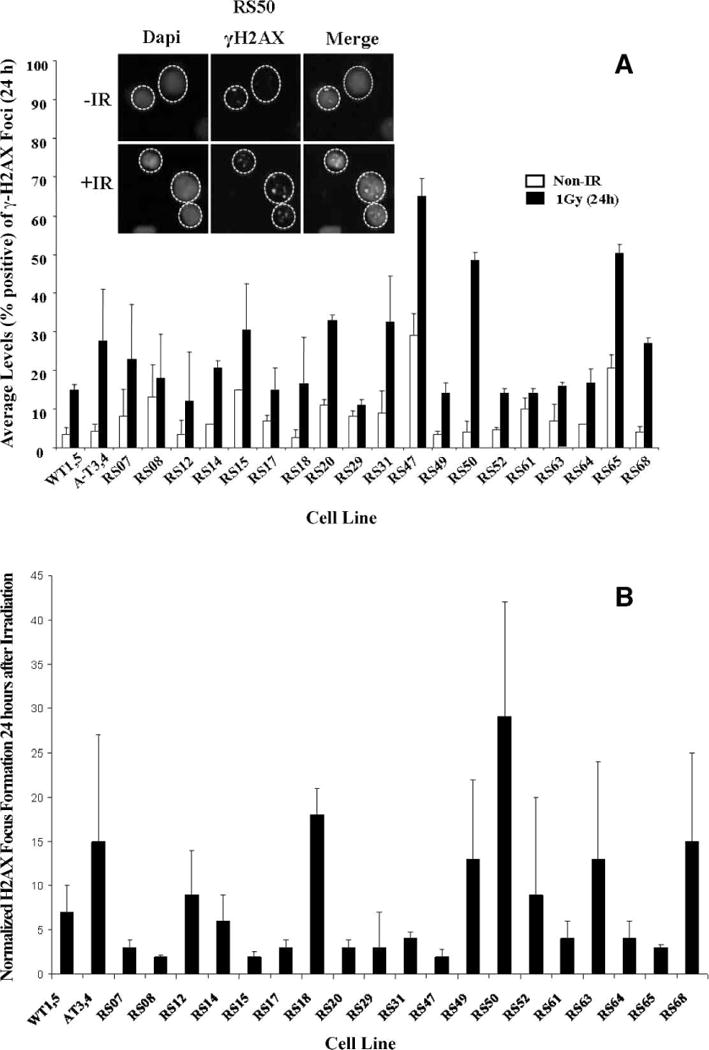
FIG. 3.

Radiation-induced γ-H2AX focus formation. Panel A: Cells were harvested 24 h after irradiation, stained for γ-H2AX detection (green), counterstained with DAPI (blue), and scored for nuclei with >4 foci. One hundred nuclei were counted per sample (31). WT1 and 5 and AT3 and 4 cells were used as controls. Panel B: Normalization of γ-H2AX focus formation 24 h postirradiation to nonirradiated (spontaneous) focus formation in panel A. Error bars represent means ± SD. N = 3. Inset: representative data for RS50.
