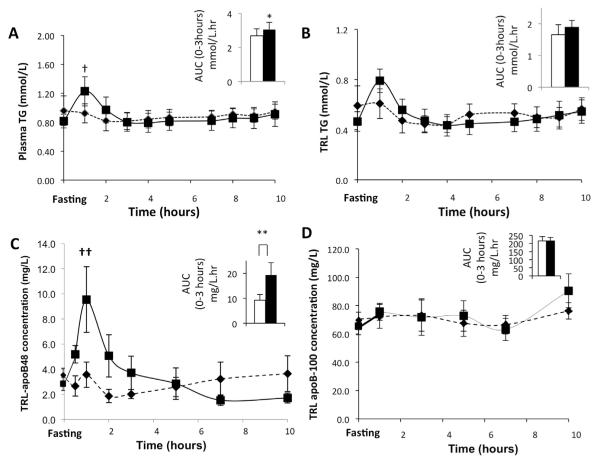
Figure 2.
Mean (n = 6) plasma (A) TG concentration, (B) TRL TG, (C) TRL apo-B48, and (D) TRL apoB-100 concentrations after subcutaneous administration of either GLP-2 or placebo (placebo, black diamond and dotted line; GLP-2, black square and solid line) was assessed during the course of the kinetic study. The mean AUC for the first 3 hours after either GLP-2 or placebo administration is shown in the inset for each of these parameters (placebo, white bar; GLP-2, black bar). (A) GLP-2 treatment caused a transient increase in plasma TG level with a significant increase in both AUC in the first 3 hours and peak concentration at 1 hour. †P = .03, *P = .03. (B) There was no change in TRL TG concentration as assessed by AUC in the first 3 hours and peak concentration at 1 hour. (C) GLP-2 treatment caused a transient increase in TRL apoB-48 concentration, with a significant increase in both AUC in the first 3 hours and peak concentration at 1 hour. ††P = .02, **P = .02. (D) GLP-2 did not affect TRL apoB-100 concentration.

