Figure 6.
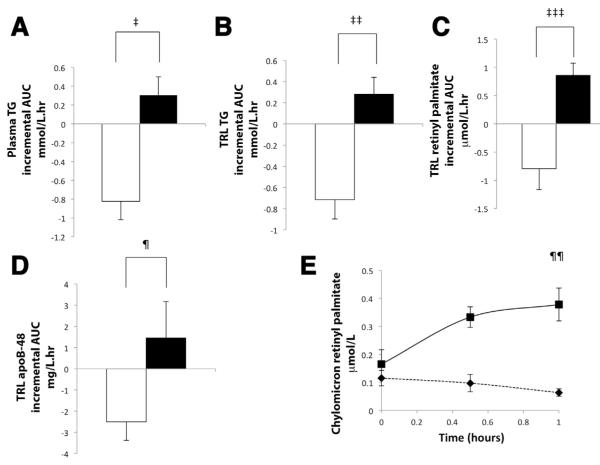
(A–D) Bar charts illustrating the mean (n = 6) incremental AUC curve vs time (with the T = 0 hour concentration taken as the baseline) (positive bars above zero indicate an increase in concentration and negative bars below zero indicate a decrease in concentration) for the first 3 hours after administration of either GLP-2 or placebo at T = 0 (placebo, white bar and black outline; GLP-2, black bar) for the following parameters: (A) plasma TG, (B) TRL TG, (C) TRL retinyl palmitate, and (D) TRL apoB-48. GLP-2 significantly increased plasma TG (‡P = .01), TRL TG (‡‡P .007), TRL retinyl palmitate (‡‡‡P = .002), and TRL apoB-48 (¶P = .04) concentrations compared with a decrease in these parameters with placebo. (E) Mean concentration curves of chylomicron retinyl palmitate immediately before (T = 0 hours) and up to 60 minutes after administration of GLP-2 and placebo (placebo, black diamond and dotted line; GLP-2, black square and solid line) (n = 5). GLP-2 significantly increased the chylomicron retinyl palmitate concentration at 60 minutes (¶¶P = .003).

